This page was generated from
docs/Examples/Garnet_Geotherms/Geotherm_functions.ipynb.
Interactive online version:
![]() .
.
Garnet Geotherms
[ ]:
import numpy as np
import matplotlib.pyplot as plt
import Thermobar as pt
[2]:
#Here let's recalculate T-P from the study of Tappe et al. (2021).
#First creating the composition arrays.
out=pt.import_excel('Tappe2021.xlsx', sheet_name="Sheet1")
myOpxs = out['Opxs']
myCpxs = out['Cpxs']
myGts = out['Gts']
#Iterative solution of Brey and Köhler (1990) for the given dataset.
calc=pt.calculate_pyroxenes_garnet_press_temp(opx_comps=myOpxs, cpx_comps=myCpxs,
                                              gt_comps = myGts, equationP="P_Brey1990",
                                              equationT="T_Brey1990",T_K_guess = 1300)
calc
/home/sinan/.local/lib/python3.10/site-packages/pandas/core/indexing.py:2115: FutureWarning: In a future version, the Index constructor will not infer numeric dtypes when passed object-dtype sequences (matching Series behavior)
  new_ix = Index(new_ix)
/home/sinan/.local/lib/python3.10/site-packages/pandas/core/indexing.py:2115: FutureWarning: In a future version, the Index constructor will not infer numeric dtypes when passed object-dtype sequences (matching Series behavior)
  new_ix = Index(new_ix)
[2]:
| P_kbar_calc | T_K_calc | |
|---|---|---|
| 0 | 62.186165 | 1665.508418 |
| 1 | 59.185112 | 1638.988377 |
| 2 | 60.174362 | 1663.121565 |
| 3 | 61.142703 | 1644.163358 |
| 4 | 62.367269 | 1680.010277 |
| 5 | 60.658036 | 1653.928696 |
| 6 | 60.041928 | 1648.787123 |
| 7 | 62.232799 | 1654.135943 |
| 8 | 65.247289 | 1667.306600 |
| 9 | 57.612930 | 1653.004617 |
| 10 | 61.387758 | 1627.492544 |
| 11 | 49.661312 | 1435.644159 |
| 12 | 57.120652 | 1646.498971 |
[4]:
T_ext = calc['T_K_calc']
P_ext = calc['P_kbar_calc'] / 10.0
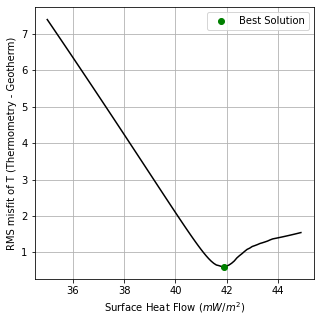
#Solving for SHF values between 35 (SHF_start) and 45 (SHF_end) for the function with increments of 0.1 (SHF increment)
#to minimise the RMS misfit function find the best fitting geotherm.
#Adiabat=True adds adiabat to the end of the conductive geotherm.
#Kinked=True adds kinked geotherm at the temperature BDL_T, parallel to the D-G transition.
#max_depth=maximum depth until the geotherm is calculated.
#plot_solution=True returns a graph of minimisation process.
shf_solution, T_solution, depth_solution, p_solution, misfit_solution = pt.invert_generalised_mantle_geotherm(P_sample = P_ext, T_sample = T_ext, std_P = 0.3, std_T = 50,
SHF_start = 35, SHF_end=45, SHF_increment=0.1, max_depth=300, kinked=False, BDL_T = 170, adiabat = True,
plot_solution = True)
[5]:
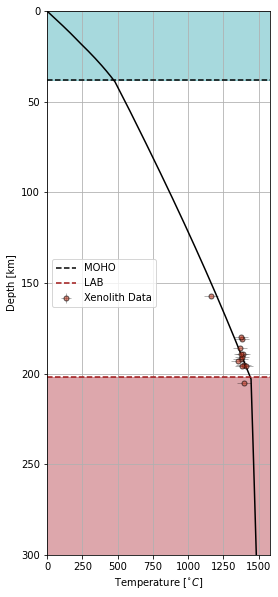
#Making a plot of the solution.
pt.mantle_geotherm_plot(T = T_solution, P = p_solution, Depth = depth_solution,
                        plot_style = 'Depth', Temp_unit = 'Celsius',
                        T_Sample = T_ext, P_Sample = P_ext, T_std = 50,
                        P_std = 0.3, plot_type = 'show', max_depth = 250,
                        moho = 38, lab = 202, leg = True)
[6]:
help(pt.mantle_geotherm_plot)
Help on function mantle_geotherm_plot in module Thermobar.plotting:

mantle_geotherm_plot(T, P, Depth, plot_style, Temp_unit, T_Sample, P_Sample, T_std, P_std, max_depth, plot_type, **kwargs)
    A function to plot calculate geotherm alongside the thermobarometric
    calculations.

    ###Parameters###
    T: Temperature array of the geotherm.

    P: Pressure array of the geotherm.

    Depth: Depth array of the geotherm in meters.

    plot_style: String parameter for the y-axis of the geotherm plot 'Pressure' or 'Depth'.

    Temp_unit: String parameter for the temperature unit, 'Celsius' or 'Kelvin'.

    T_Sample: Array of temperature of the thermobarometric solutions.

    P_Sample: Array of pressure of the thermobarometric solutions in GPa.

    T_std: Standart deviation of thermobarometric temperature estimation. Could be array or a single value.

    P_std: Standart deviation of thermobarometric pressure estimation. Could be array or a single value.

    max_depth: Maximum depth to show the plot.

    leg: Boolean parameter to set existence of a legend.

    plot_type: 'show' or 'save' the figure.

    moho: moho depth in km.

    lab: lab depth in km.

    Depth_Sample: Array of depths of the thermobarometric solutions.

    filename_save: string parameter for filename to save the figures.
[ ]: