This page was generated from
docs/Examples/Five_min_intro.ipynb.
Interactive online version:
![]() .
.
A five minute intro to Thermobar
For more information and examples, see the read-the-docs page. https://thermobar.readthedocs.io/en/latest/index.html, which has links to YouTube Videos.
You can download the excel spreadsheet you need here: https://github.com/PennyWieser/Thermobar/blob/main/docs/Examples/Five_min_intro.xlsx, click on the download button, and put in the same folder as this notebook

1 - Introduction
Thermobar is a Python thermobarometry tool. It implements many thermometer and barometer calibrations for single phase (e.g., cpx oer amph) and melt-crystal equilibria (e.g., cpx-liq etc.)
We recomending importing 3 essential python packages, pandas which allows data to be treated a bit like an excel spreadsheet (with column headings), numpy which does math operations, and matplotlib which does plotting.
[1]:
import pandas as pd
import numpy as np
import matplotlib.pyplot as plt
2 - Installing and importing Thermobar
First, we install Thermobar using “pip”, you only need to do this once on your computer (although you may wish to update as new features are added)
[2]:
#!pip install Thermobar
Now we import the thermobarometry tool itself. this is imported as pt, so any time you want to call a function from Thermobar, you do pt.function_name
[3]:
import Thermobar as pt
You can get the version (which you should state in a paper) using the following code
[4]:
pt.__version__
[4]:
'1.0.7'
3 - Load data from an Excel file
Excel file is formatted with oxide names, followed by the phase (e.g., SiO2_Liq for the SiO2 content of the liquid, SiO2_Cpx for the Cpx).
In this case, it is reading the file named “Five_min_intro.xlsx”, from Sheet1
The import_excel function return a dictionary called “out”, which is a collection of formatted dataframes, with one for each phase. /
We can access these dictionaries using their “keys” within square brackets (i.e., ‘Liqs’ and’ Cpxs’) and extract 2 dataframes, which we call Liqs and Cpxs
The order of headings doesn’t matter.
You can also have any other columns, e.g., estimate of pressure from any other proxy (melt inclusions, geophysics), and anything else you might want to plot (e.g., latitude, longitude)
[5]:
out=pt.import_excel('Five_min_intro.xlsx', sheet_name="Sheet1")
my_input=out['my_input']
Liqs=out['Liqs']
Cpxs=out['Cpxs']
The following are the phase identification names you should use when formatting an excel spreadsheet
Phase identification:
_Liq: Liquid (the melt)
_Ol: olivine
_Cpx: clinopyroxene
_Plag: plagioclase
_Kspar: kfeldspar
_Opx: ortopyroxene
_Amp: amphibole
_Sp: spinel
If you only have one phase, you can also skip the bit where you change the column names, and just state the phase name in the import function as suffix = “ “…
Here, we are reading from the sheet “Liq_noheader” to demonstrate this
3b - Only 1 phase
[6]:
out_noheads=pt.import_excel('Five_min_intro.xlsx', sheet_name="Liq_noheader", suffix="_Liq")
Liqs_noheads=out_noheads['Liqs']
4. Inspect data
you should always inspect data to check it has read in correctly, and Thermobar has intepreted all the column headings how you wanted them.
In particular, check that you have numbers in the FeOt column. If your heading was FeO, this may be empty. It needs to be FeOt in the user-inputted spreadsheet to avoid ambiguities with Fe partitioning
Sometimes your column headings may have funny characters due to use of spaces, subscripts etc. in journal pdf tables. Check that all the columns you entered have numbers. If, say your SiO2_Liq heading had funny characters, this column will be filled with zeros when you inspect it.
by default, if you don’t have a Sample_ID_phase column, but just a Sample_ID column, the Sample_ID column in each dataframes will be replaced with the index (E.g., 0, 1, 2, 3).
The head function shows the first 5 columns. Too look at more columns, remove .head()
[7]:
display(Liqs.head())
display(Cpxs.head())
| SiO2_Liq | TiO2_Liq | Al2O3_Liq | FeOt_Liq | MnO_Liq | MgO_Liq | CaO_Liq | Na2O_Liq | K2O_Liq | Cr2O3_Liq | P2O5_Liq | H2O_Liq | Fe3Fet_Liq | NiO_Liq | CoO_Liq | CO2_Liq | Sample_ID_Liq | |
|---|---|---|---|---|---|---|---|---|---|---|---|---|---|---|---|---|---|
| 0 | 51.1 | 0.93 | 17.5 | 8.91 | 0.18 | 6.09 | 11.50 | 3.53 | 0.17 | 0 | 0.15 | 3.8 | 0.0 | 0.0 | 0.0 | 0.0 | 0 |
| 1 | 51.5 | 1.19 | 19.2 | 8.70 | 0.19 | 4.98 | 10.00 | 3.72 | 0.42 | 0 | 0.14 | 6.2 | 0.0 | 0.0 | 0.0 | 0.0 | 1 |
| 2 | 59.1 | 0.54 | 19.1 | 5.22 | 0.19 | 3.25 | 7.45 | 4.00 | 0.88 | 0 | 0.31 | 6.2 | 0.0 | 0.0 | 0.0 | 0.0 | 2 |
| 3 | 52.5 | 0.98 | 19.2 | 8.04 | 0.20 | 4.99 | 9.64 | 4.15 | 0.21 | 0 | 0.14 | 6.2 | 0.0 | 0.0 | 0.0 | 0.0 | 3 |
| 4 | 56.2 | 0.34 | 20.4 | 5.88 | 0.20 | 2.58 | 7.18 | 6.02 | 1.02 | 0 | 0.23 | 6.2 | 0.0 | 0.0 | 0.0 | 0.0 | 4 |
| SiO2_Cpx | TiO2_Cpx | Al2O3_Cpx | FeOt_Cpx | MnO_Cpx | MgO_Cpx | CaO_Cpx | Na2O_Cpx | K2O_Cpx | Cr2O3_Cpx | Sample_ID_Cpx | |
|---|---|---|---|---|---|---|---|---|---|---|---|
| 0 | 51.5 | 0.50 | 3.70 | 5.18 | 0.09 | 15.8 | 22.8 | 0.24 | 0 | 0.66 | 0 |
| 1 | 50.3 | 0.73 | 4.12 | 5.83 | 0.00 | 15.0 | 22.7 | 0.24 | 0 | 0.28 | 1 |
| 2 | 47.3 | 1.75 | 7.85 | 6.51 | 0.14 | 13.1 | 22.5 | 0.25 | 0 | 0.22 | 2 |
| 3 | 51.1 | 0.63 | 4.41 | 5.66 | 0.13 | 15.6 | 22.6 | 0.23 | 0 | 0.27 | 3 |
| 4 | 51.0 | 0.56 | 4.14 | 7.33 | 0.20 | 14.4 | 22.4 | 0.31 | 0 | 0.09 | 4 |
5 - Getting help
The help() method provide you relevant information about any function, e.g., here we want information on the function for calculating Cpx-Liq temperature:
[8]:
help(pt.calculate_cpx_liq_temp)
Help on function calculate_cpx_liq_temp in module Thermobar.clinopyroxene_thermobarometry:

calculate_cpx_liq_temp(*, equationT, cpx_comps=None, liq_comps=None, meltmatch=None, P=None, eq_tests=False, H2O_Liq=None, Fe3Fet_Liq=None, sigma=1, Kd_Err=0.03)
    Clinopyroxene-Liquid thermometry, calculates temperature in Kelvin
    (and equilibrium tests as an option)

    Parameters
    -------
    cpx_comps: pandas.DataFrame
        Clinopyroxene compositions with column headings SiO2_Cpx, MgO_Cpx etc.

    liq_comps: pandas.DataFrame
        Liquid compositions with column headings SiO2_Liq, MgO_Liq etc.

    Or:

    meltmatch: pandas.DataFrame
        Combined dataframe of cpx-Liquid compositions
        Used for calculate_cpx_liq_press_temp_matching function.

    EquationT: str
        Choice of equation:
        Cpx-Liquid
        |  T_Put1996_eqT1  (P-indep, H2O-indep)
        |  T_Mas2013_eqTalk1  (P-indep, H2O-indep, alk adaption of T1)
        |  T_Brug2019  (P-indep, H2O-indep)
        |  T_Put1996_eqT2 (P-dep, H2O-indep)
        |  T_Mas2013_eqTalk2  (P-dep, H2O-indep, alk adaption of T2)
        |  T_Put1999  (P-dep, H2O-indep)
        |  T_Put2003  (P-dep, H2O-indep)
        |  T_Put1999  (P-dep, H2O-indep)
        |  T_Put2008_eq33  (P-dep, H2O-dep)
        |  T_Mas2013_eqalk33  (P-dep, H2O-dep, alk adaption of eq33)
        |  T_Mas2013_Palk2012 (P-indep, H2O_dep)
        |  T_Petrelli2020_Cpx_Liq (gives voting)
        |  T_Jorgenson2022_Cpx_Liq (gives voting)
        |  T_Petrelli2020_Cpx_Liq_onnx (gives consistent result every time)


    P: float, int, pandas.Series, str  ("Solve")
        Pressure in kbar
        Only needed for P-sensitive thermometers.
        If enter P="Solve", returns a partial function
        Else, enter an integer, float, or panda series


    eq_tests: bool
        If False, just returns pressure (default) as a panda series
        If True, returns pressure, Values of Eq tests,
        Values of Eq tests (Kd, EnFs, DiHd, CaTs, CrCaTs),
        as well as user-entered cpx and liq comps and components.


    Returns
    -------
    If eq_tests=False
        pandas.Series: Temperature in Kelvin
    If eq_tests=True
        pandas.DataFrame: Temperature in Kelvin +
        Eq Tests + cpx+liq comps + components
You can also get help on specific equations to find out what inputs they use:
[9]:
help(pt.T_Put2008_eq33)
Help on function T_Put2008_eq33 in module Thermobar.clinopyroxene_thermobarometry:

T_Put2008_eq33(P, *, H2O_Liq, Mg_Number_Liq_NoFe3, Ca_Liq_cat_frac, Si_Liq_cat_frac, Ti_Liq_cat_frac, Na_Liq_cat_frac, K_Liq_cat_frac, EnFs, lnK_Jd_DiHd_liq_2003)
    Clinopyroxene-liquid  thermometer of Putirka (2008) Eq 33.
    :cite:`putirka2008thermometers`

    SEE=+-45°C (all data)
6 - Can perform calculations just for pressure if you know temperature
For all functions, the form is calculate_phase1name_phase2name_press, or if its a single-phase barometer, calculate_phase1name_only_press
Specify dataframes of phase compositions after _comps=, and specify equationP. If the barometer requires a temperature, you can enter it as a single value, or as a column (see Liquid folder for more info)
[10]:
# Here performing calculations at 1300 K
Press_eq30_1300K=pt.calculate_cpx_liq_press(cpx_comps=Cpxs, liq_comps=Liqs,
                            equationP="P_Put2008_eq30", T=1300)
7 - Similarly, for temperature at a known pressure
Same as for press, but with the ending _temp instead, and equationT
[11]:
# Here performing calculations at 5 kbar
Temp_eq33_5kbar=pt.calculate_cpx_liq_temp(cpx_comps=Cpxs, liq_comps=Liqs,
                                          equationT="T_Put2008_eq33", P=5)
8 - If you don’t know either P or T
You can iterate an equation for pressure with an equation for temp for the more realistic situation where you don’t know either
[12]:
PT_iter_30_33=pt.calculate_cpx_liq_press_temp(cpx_comps=Cpxs, liq_comps=Liqs,
                                            equationP="P_Put2008_eq30", equationT="T_Put2008_eq33")
PT_iter_30_33
[12]:
| P_kbar_calc | T_K_calc | Delta_P_kbar_Iter | Delta_T_K_Iter | |
|---|---|---|---|---|
| 0 | 2.530914 | 1352.408784 | 0.0 | 0.0 |
| 1 | 1.786845 | 1290.151507 | 0.0 | 0.0 |
| 2 | 1.171520 | 1255.933868 | 0.0 | 0.0 |
| 3 | 2.143416 | 1292.669093 | 0.0 | 0.0 |
| 4 | 2.763538 | 1243.469600 | 0.0 | 0.0 |
In the example above, calculate_cpx_liq_press_temp iterates equation 30 from Putirka (2008) for P, and equation 33 from Putirka (2008) for temperature. The output is a panda’s dataframe.
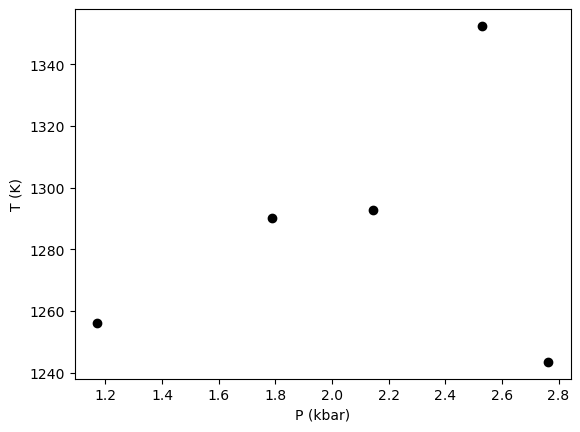
9 - Can plot a very simple x-y diagram using matplotlib (loaded as plt)
You take the dataframe name (i.e., PT_iter_30_31), and use square brackets to specify a certain column name
[13]:
plt.plot(PT_iter_30_33['P_kbar_calc'], PT_iter_30_33['T_K_calc'], 'ok')
plt.xlabel('P (kbar)')
plt.ylabel('T (K)')
[13]:
Text(0, 0.5, 'T (K)')
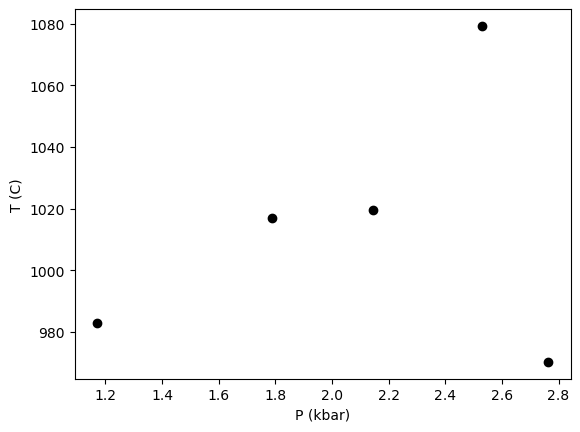
9b - If you want to plot Temperature in Celcius instead, you can simply subtract 273.15 from the dataframe:
[14]:
plt.plot(PT_iter_30_33['P_kbar_calc'], PT_iter_30_33['T_K_calc']-273.15, 'ok')
plt.xlabel('P (kbar)')
plt.ylabel('T (C)')
[14]:
Text(0, 0.5, 'T (C)')
10 - Example of warnings for incorrect inputs
Here, we read from the sheet “wrong_header_caps” to demonstrate what happens if the phase identifiers are lower case in the input spreadsheet.
The function returns a warning, saying that it has found lower case names. It may be that you are using these for another purpose, but these are not recognised by the function.
[15]:
out2=pt.import_excel('Five_min_intro.xlsx', sheet_name="wrong_header_caps")
Cpxs2=out2['Cpxs']
g:\my drive\postdoc\pymme\mybarometers\thermobar_outer\src\Thermobar\import_export.py:345: UserWarning: You've got a column heading with a lower case _cpx, this is okay if this column is for your own use, but if its an input to Thermobar, it needs to be capitalized (_Cpx)
  w.warn("You've got a column heading with a lower case _cpx, this is okay if this column is for your"
g:\my drive\postdoc\pymme\mybarometers\thermobar_outer\src\Thermobar\import_export.py:373: UserWarning: You've got a column heading with a lower case _liq, this is okay if this column is for your own use, but if its an input to Thermobar, it needs to be capitalized (_Liq)
  w.warn("You've got a column heading with a lower case _liq, this is okay if this column is for your"
By inspecting the dataframes extracted from this input, you can see that Thermobar couldnt find any relevant column headings as all the columns except the sample ID are 0. This is why we recomend users always inspect dataframes before proceeding to calculations!
[16]:
display(Cpxs2.head())
| SiO2_Cpx | TiO2_Cpx | Al2O3_Cpx | FeOt_Cpx | MnO_Cpx | MgO_Cpx | CaO_Cpx | Na2O_Cpx | K2O_Cpx | Cr2O3_Cpx | Sample_ID_Cpx | |
|---|---|---|---|---|---|---|---|---|---|---|---|
| 0 | 0.0 | 0.0 | 0.0 | 0.0 | 0.0 | 0.0 | 0.0 | 0.0 | 0.0 | 0.0 | 0 |
| 1 | 0.0 | 0.0 | 0.0 | 0.0 | 0.0 | 0.0 | 0.0 | 0.0 | 0.0 | 0.0 | 1 |
| 2 | 0.0 | 0.0 | 0.0 | 0.0 | 0.0 | 0.0 | 0.0 | 0.0 | 0.0 | 0.0 | 2 |
| 3 | 0.0 | 0.0 | 0.0 | 0.0 | 0.0 | 0.0 | 0.0 | 0.0 | 0.0 | 0.0 | 3 |
| 4 | 0.0 | 0.0 | 0.0 | 0.0 | 0.0 | 0.0 | 0.0 | 0.0 | 0.0 | 0.0 | 4 |
11 - Example of Error when you don’t have an FeOt column…
Here, we load from the sheet “no_feot”, which only has a heading FeO.
This returns an error telling you to go make an FeOt column.
[17]:
out3=pt.import_excel('Five_min_intro.xlsx', sheet_name="no_feot")
Liqs3=out3['Liqs']
---------------------------------------------------------------------------
ValueError                                Traceback (most recent call last)
Input In [17], in <cell line: 1>()
----> 1 out3=pt.import_excel('Five_min_intro.xlsx', sheet_name="no_feot")
      2 Liqs3=out3['Liqs']

File g:\my drive\postdoc\pymme\mybarometers\thermobar_outer\src\Thermobar\import_export.py:389, in import_excel(filename, sheet_name, sample_label, GEOROC, suffix)
    385         my_input_c['FeOt_Liq']=my_input_c['FeO_Liq']+my_input_c['Fe2O3_Liq']*0.89998
    388     else:
--> 389         raise ValueError("No FeOt found. You've got a column heading with FeO. To avoid errors based on common EPMA outputs"
    390     " thermobar only recognises columns with FeOt for all phases except liquid"
    391     " where you can also enter a Fe3Fet_Liq heading used for equilibrium tests")
    393 # if any(my_input.columns.str.contains("Fe2O3_")) and (all(my_input.columns.str.contains("FeOt_")==False)):
    394 #     raise ValueError("No FeOt column found. You've got a column heading with Fe2O3. To avoid errors based on common EPMA outputs"
    395 #     " thermobar only recognises columns with FeOt for all phases except liquid"
    396 #     " where you can also enter a Fe3Fet_Liq heading used for equilibrium tests")
    398 if any(my_input.columns.str.contains("FeOT_")) and (all(my_input.columns.str.contains("FeOt_")==False)):

ValueError: No FeOt found. You've got a column heading with FeO. To avoid errors based on common EPMA outputs thermobar only recognises columns with FeOt for all phases except liquid where you can also enter a Fe3Fet_Liq heading used for equilibrium tests
What about if you have FeO and Fe2O3?
For liquid, if you have FeO_Liq and Fe2O3_Liq headings, it can handle this…
[18]:
out4=pt.import_excel('Five_min_intro.xlsx', sheet_name="Feo_Fe2O3")
Liqs4=out4['Liqs']
[19]:
Liqs4
[19]:
| SiO2_Liq | TiO2_Liq | Al2O3_Liq | FeOt_Liq | MnO_Liq | MgO_Liq | CaO_Liq | Na2O_Liq | K2O_Liq | Cr2O3_Liq | P2O5_Liq | H2O_Liq | Fe3Fet_Liq | NiO_Liq | CoO_Liq | CO2_Liq | Sample_ID_Liq | |
|---|---|---|---|---|---|---|---|---|---|---|---|---|---|---|---|---|---|
| 0 | 51.1 | 0.93 | 17.5 | 9.809980 | 0.18 | 6.09 | 11.50 | 3.53 | 0.17 | 0 | 0.15 | 3.8 | 0.0 | 0.0 | 0.0 | 0.0 | 0 |
| 1 | 51.5 | 1.19 | 19.2 | 10.049970 | 0.19 | 4.98 | 10.00 | 3.72 | 0.42 | 0 | 0.14 | 6.2 | 0.0 | 0.0 | 0.0 | 0.0 | 1 |
| 2 | 59.1 | 0.54 | 19.1 | 7.199956 | 0.19 | 3.25 | 7.45 | 4.00 | 0.88 | 0 | 0.31 | 6.2 | 0.0 | 0.0 | 0.0 | 0.0 | 2 |
| 3 | 52.5 | 0.98 | 19.2 | 9.119976 | 0.20 | 4.99 | 9.64 | 4.15 | 0.21 | 0 | 0.14 | 6.2 | 0.0 | 0.0 | 0.0 | 0.0 | 3 |
| 4 | 56.2 | 0.34 | 20.4 | 7.049974 | 0.20 | 2.58 | 7.18 | 6.02 | 1.02 | 0 | 0.23 | 6.2 | 0.0 | 0.0 | 0.0 | 0.0 | 4 |
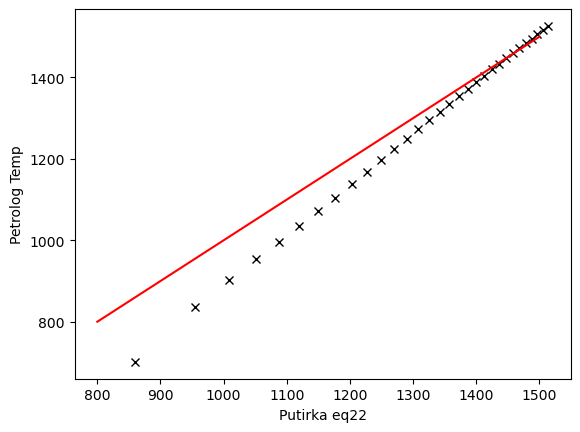
What about loading in data from Petrolog?
You will want to use the package PySulfSat, which has a function inbuilt for this
Please cite https://eartharxiv.org/repository/view/4624/!
[20]:
# !pip install PySulfSat
import PySulfSat as ss
df_out=ss.import_data('PetrologCalculations.xlsx', Petrolog=True)
We have replaced all missing liquid oxides and strings with zeros.
[22]:
df_out.head()
[22]:
| SiO2_Liq | TiO2_Liq | Al2O3_Liq | FeOt_Liq | MnO_Liq | MgO_Liq | CaO_Liq | Na2O_Liq | K2O_Liq | P2O5_Liq | ... | Olv_%_magma | Olv_Peritectic | Fluid_%_magma | Olv_%_cumulate | Sample | Unnamed:58 | fo2_calc | fo2_e_calc | T_K | P_kbar | |
|---|---|---|---|---|---|---|---|---|---|---|---|---|---|---|---|---|---|---|---|---|---|
| 0 | 49.9010 | 0.9981 | 14.9715 | 8.980926 | 0.0998 | 9.9763 | 11.9772 | 2.4953 | 0.1996 | 0.0998 | ... | 0 | N | 0 | 0.0100 | PetrologDefault | 08:21:15 | 1.905461e-08 | 0.000444 | 1526.431 | 1 |
| 1 | 49.9978 | 1.0081 | 15.1220 | 8.951296 | 0.1008 | 9.6064 | 12.0976 | 2.5203 | 0.2016 | 0.1008 | ... | 0 | N | 0 | 1.0050 | PetrologDefault | 08:21:15 | NaN | NaN | 1516.580 | 1 |
| 2 | 50.0982 | 1.0185 | 15.2770 | 8.916645 | 0.1018 | 9.2279 | 12.2216 | 2.5462 | 0.2037 | 0.1018 | ... | 0 | N | 0 | 2.0096 | PetrologDefault | 08:21:15 | NaN | NaN | 1506.214 | 1 |
| 3 | 50.2003 | 1.0289 | 15.4337 | 8.877334 | 0.1029 | 8.8486 | 12.3469 | 2.5723 | 0.2058 | 0.1029 | ... | 0 | N | 0 | 3.0041 | PetrologDefault | 08:21:15 | NaN | NaN | 1495.511 | 1 |
| 4 | 50.3062 | 1.0397 | 15.5950 | 8.832002 | 0.1040 | 8.4612 | 12.4760 | 2.5992 | 0.2079 | 0.1040 | ... | 0 | N | 0 | 4.0077 | PetrologDefault | 08:21:15 | NaN | NaN | 1484.230 | 1 |
5 rows × 66 columns
[34]:
Peq22=pt.calculate_liq_only_temp(liq_comps=df_out, equationT='T_Put2008_eq22_BeattDMg',
                                P=df_out['P_kbar'])
[35]:
plt.plot(Peq22, df_out['T_K'], 'xk')
plt.plot([800, 1500], [800, 1500], '-r')
plt.xlabel('Putirka eq22 (K)')
plt.ylabel('Petrolog Temp (K)')
[35]:
Text(0, 0.5, 'Petrolog Temp')
[ ]: