This page was generated from
docs/Examples/Other_features/Calculating_Viscosity.ipynb.
Interactive online version:
![]() .
.
Calculating Viscosity from liquid compositions
This notebook shows how to calculate Viscosity using Giordano et al. (2008)
You can download the Excel spreadsheet from: https://github.com/PennyWieser/Thermobar/blob/main/docs/Examples/Other_features/Viscoity_Giordano.xlsx
[1]:
# If you haven't done so, pip install Thermobar by removing the # symbol
#!pip install Thermobar
[2]:
import numpy as np
import pandas as pd
import Thermobar as pt
import matplotlib.pyplot as plt
pd.options.display.max_columns = None
Lets load in some melt compositions from a MELTS model published in Wieser et al. (2022)
[3]:
Liqs_import2=pt.import_excel('Viscoity_Giordano.xlsx', sheet_name='MELTSTest', suffix="_Liq")
Liqs2=Liqs_import2['Liqs']
Liqs_input2=Liqs_import2['my_input']
Inspect the liquid data you have loaded in to make sure it makes sense
[4]:
Liqs2.head()
[4]:
| SiO2_Liq | TiO2_Liq | Al2O3_Liq | FeOt_Liq | MnO_Liq | MgO_Liq | CaO_Liq | Na2O_Liq | K2O_Liq | Cr2O3_Liq | P2O5_Liq | H2O_Liq | Fe3Fet_Liq | NiO_Liq | CoO_Liq | CO2_Liq | Sample_ID_Liq | |
|---|---|---|---|---|---|---|---|---|---|---|---|---|---|---|---|---|---|
| 0 | 51.456179 | 2.601690 | 13.529073 | 11.114610 | 0.185873 | 6.698477 | 10.974609 | 2.406926 | 0.483801 | 0.0 | 0.248535 | 0.508277 | 0.0 | 0.0 | 0.0 | 0.0 | 0 |
| 1 | 51.462403 | 2.641448 | 13.717522 | 11.175642 | 0.189570 | 6.497934 | 10.814571 | 2.451116 | 0.493423 | 0.0 | 0.253478 | 0.518386 | 0.0 | 0.0 | 0.0 | 0.0 | 1 |
| 2 | 51.491657 | 2.771451 | 13.666925 | 11.521905 | 0.200504 | 6.275374 | 10.459901 | 2.509225 | 0.520502 | 0.0 | 0.268098 | 0.548285 | 0.0 | 0.0 | 0.0 | 0.0 | 2 |
| 3 | 51.508276 | 2.872896 | 13.569897 | 11.795709 | 0.208908 | 6.138356 | 10.217900 | 2.543802 | 0.541088 | 0.0 | 0.279336 | 0.571268 | 0.0 | 0.0 | 0.0 | 0.0 | 3 |
| 4 | 51.506960 | 3.058952 | 13.350351 | 12.214913 | 0.223782 | 5.856971 | 9.977521 | 2.592645 | 0.577148 | 0.0 | 0.299224 | 0.611940 | 0.0 | 0.0 | 0.0 | 0.0 | 4 |
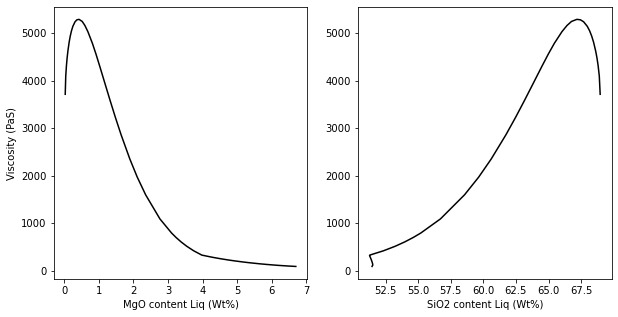
Lets calculate viscosity at the temperature stored in the column “Temp HT1987_K”
Here, we had already calculated temperature using Helz and Thornber, which was stored in the input spreadsheet in a column named ‘Temp HT1987_K’
The dataframe Liqs_input2 contains all input columns, so we can access the values stored in this column using Liqs_input2[‘Temp HT1987_K’]
This temperature needs to be in Kelvin!
[5]:
Calc_ExcelT=pt.calculate_viscosity_giordano_2008(liq_comps=Liqs2,
                                                  T=Liqs_input2['Temp HT1987_K'])
[10]:
fig, (ax1, ax2) = plt.subplots(1, 2, figsize=(10,5))
ax1.plot(Calc_ExcelT['MgO_Liq'], Calc_ExcelT['n_melt'], '-k')
ax2.plot(Calc_ExcelT['SiO2_Liq'], Calc_ExcelT['n_melt'], '-k')

ax1.set_ylabel('Viscosity (PaS)')
ax1.set_xlabel('MgO content Liq (Wt%)')
ax2.set_xlabel('SiO2 content Liq (Wt%)')
[10]:
Text(0.5, 0, 'SiO2 content Liq (Wt%)')
Using a different thermometer for temperature
You can get a list of all thermometers in Thermobar using the help function
[11]:
help(pt.calculate_liq_only_temp)
Help on function calculate_liq_only_temp in module Thermobar.liquid_thermometers:

calculate_liq_only_temp(*, liq_comps, equationT, P=None, H2O_Liq=None, print=False)
     Liquid-only thermometery. Returns a temperature in Kelvin.

    Parameters
     -------

     liq_comps: pandas.DataFrame
         liquid compositions with column headings SiO2_Liq, MgO_Liq etc.

     equationT: str
         If has _sat at the end, represents the saturation surface of that mineral.

         Equations from Putirka et al. (2016).
             | T_Put2016_eq3_amp_sat (saturation surface of amphibole)

         Equations from Putirka (2008) and older studies:

             | T_Put2008_eq13
             | T_Put2008_eq14
             | T_Put2008_eq15
             | T_Put2008_eq16
             | T_Put2008_eq34_cpx_sat
             | T_Put2008_eq28b_opx_sat
             | T_Put1999_cpx_sat
             * Following 3 thermometers are adaptations of olivine-liquid thermometers with  DMg calculated using Beattie 1993,
             This means you can use them without knowing an olivine composition. ocan be applied when you haven't measured an olivine composiiton.
             | T_Put2008_eq19_BeattDMg
             | T_Put2008_eq21_BeattDMg
             | T_Put2008_eq22_BeattDMg

         Equations from Sugawara (2000):

             | T_Sug2000_eq1
             | T_Sug2000_eq3_ol
             | T_Sug2000_eq3_opx
             | T_Sug2000_eq3_cpx
             | T_Sug2000_eq3_pig
             | T_Sug2000_eq6a
             | T_Sug2000_eq6b

         Equations from Helz and Thornber (1987):

             | T_Helz1987_MgO
             | T_Helz1987_CaO

         Equation from Molina et al. (2015)

             | T_Molina2015_amp_sat

         Equation from Montrieth 1995
            | T_Montierth1995_MgO

         Equation from Beattie (1993)
            | T_Beatt1993_opx

     P: float, int, pandas.Series, str  ("Solve")
         Pressure in kbar
         Only needed for P-sensitive thermometers.
         If enter P="Solve", returns a partial function
         Else, enter an integer, float, or panda series

     H2O_Liq: optional.
         If None, uses H2O_Liq column from input.
         If int, float, pandas.Series, uses this instead of H2O_Liq Column


     Returns
     -------
     pandas series
        Temperature in K
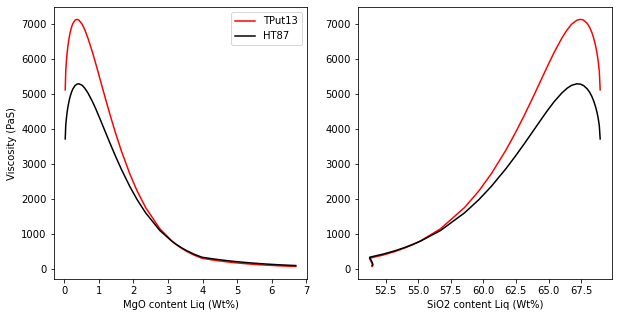
Lets use “T_Put2008_eq13”
[19]:
CalcT_eq13=pt.calculate_liq_only_temp(liq_comps=Liqs2, equationT="T_Put2008_eq13")
Calc_Puteq13=pt.calculate_viscosity_giordano_2008(liq_comps=Liqs2,
                                                  T=CalcT_eq13)
[20]:
fig, (ax1, ax2) = plt.subplots(1, 2, figsize=(10,5))
ax1.plot(Calc_Puteq13['MgO_Liq'], Calc_Puteq13['n_melt'], '-r', label='TPut13')
ax2.plot(Calc_Puteq13['SiO2_Liq'], Calc_Puteq13['n_melt'], '-r')


ax1.plot(Calc_ExcelT['MgO_Liq'], Calc_ExcelT['n_melt'], '-k', label='HT87')
ax2.plot(Calc_ExcelT['SiO2_Liq'], Calc_ExcelT['n_melt'], '-k')
ax1.legend()
ax1.set_ylabel('Viscosity (PaS)')
ax1.set_xlabel('MgO content Liq (Wt%)')
ax2.set_xlabel('SiO2 content Liq (Wt%)')
[20]:
Text(0.5, 0, 'SiO2 content Liq (Wt%)')
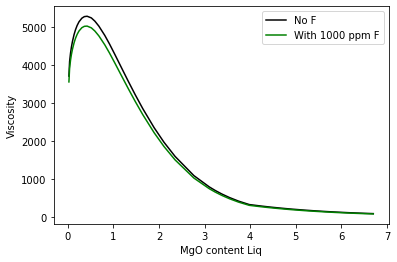
With different F2O contents
By default, we perform calculations with no F, to use the same input structure as the rest of the liquids
However, Giordano parameterize in terms of F2O, so you can enter this straight in the function
We have 2 functions, allowing you to convert from F2O to F and back
[21]:
F2O_calc=pt.convert_F_to_F2O(F_ppm=1000)
F2O_calc
[21]:
0.14210723396066502
[22]:
F_calc=pt.convert_F2O_to_F_ppm(F2O_wt=F2O_calc)
F_calc
[22]:
1000.0
[23]:
WithF=pt.calculate_viscosity_giordano_2008(liq_comps=Liqs2,
                                    T=Liqs_input2['Temp HT1987_K'],
                                     F2O_content=F2O_calc)
[25]:
plt.plot( Calc_ExcelT['MgO_Liq'], Calc_ExcelT['n_melt'], '-k', label='No F')
plt.plot( WithF['MgO_Liq'], WithF['n_melt'], '-g', label='With 1000 ppm F')
plt.legend()
plt.ylabel('Viscosity')
plt.xlabel('MgO content Liq')
[25]:
Text(0.5, 0, 'MgO content Liq')