This page was generated from
docs/Examples/Garnet_Geotherms/Garnet_Functions.ipynb.
Interactive online version:
![]() .
.
Garnet functions
[1]:
import numpy as np
import matplotlib.pyplot as plt
import Thermobar as pt
Load data from Ozaydin et al. (2021)
[2]:
#Now load the data from
data = pt.import_excel("Group1_Kimberley.xlsx", "Sheet1")
my_input_gt = data['Gts']
[3]:
my_input_gt
[3]:
| SiO2_Gt | TiO2_Gt | Al2O3_Gt | Cr2O3_Gt | FeOt_Gt | MnO_Gt | MgO_Gt | CaO_Gt | Na2O_Gt | K2O_Gt | Ni_Gt | Ti_Gt | Zr_Gt | Zn_Gt | Ga_Gt | Sr_Gt | Y_Gt | Sample_ID_Gt | |
|---|---|---|---|---|---|---|---|---|---|---|---|---|---|---|---|---|---|---|
| 0 | 41.92 | 0.03 | 21.83 | 2.73 | 8.91 | 0.51 | 18.18 | 5.34 | 0.00 | 0 | 7.04 | 179.845333 | 1.20 | 2.31 | 2.110 | 0.0 | 10.830 | 173/034/0021/2 |
| 1 | 41.46 | 0.10 | 18.27 | 6.33 | 6.60 | 0.38 | 20.05 | 5.85 | 0.02 | 0 | 8.03 | 599.484443 | 14.74 | 0.00 | 0.337 | 0.0 | 2.091 | EAK807 |
| 2 | 40.99 | 0.00 | 18.37 | 7.07 | 6.75 | 0.24 | 19.91 | 5.68 | 0.00 | 0 | 8.03 | 0.000000 | 14.74 | 0.00 | 0.337 | 0.0 | 2.091 | EAK807 |
| 3 | 42.78 | 0.21 | 20.67 | 3.08 | 6.90 | 0.28 | 21.76 | 4.58 | 0.00 | 0 | 8.21 | 1258.917331 | 20.11 | 15.64 | 6.120 | 0.0 | 2.390 | 173/033/K069/10 |
| 4 | 42.32 | 0.03 | 22.22 | 2.51 | 9.41 | 0.51 | 19.03 | 5.18 | 0.12 | 0 | 8.25 | 179.845333 | 5.01 | 5.89 | 2.220 | 0.0 | 9.440 | 173/034/0021/2 |
| ... | ... | ... | ... | ... | ... | ... | ... | ... | ... | ... | ... | ... | ... | ... | ... | ... | ... | ... |
| 5515 | 41.96 | 0.00 | 19.88 | 4.73 | 6.59 | 0.27 | 21.07 | 4.83 | 0.00 | 0 | 227.10 | 0.000000 | 18.40 | 0.00 | 3.860 | 0.0 | 0.755 | EAK807 |
| 5516 | 42.90 | 0.01 | 20.40 | 4.01 | 7.10 | 0.40 | 20.61 | 5.09 | 0.01 | 0 | 280.75 | 59.948444 | 78.03 | 0.00 | 7.900 | 0.0 | 2.340 | EAK807 |
| 5517 | 41.85 | 0.00 | 20.84 | 3.91 | 6.81 | 0.23 | 21.23 | 4.95 | 0.04 | 0 | 280.75 | 0.000000 | 78.03 | 0.00 | 7.900 | 0.0 | 2.340 | EAK807 |
| 5518 | 41.12 | 0.06 | 20.68 | 3.15 | 8.96 | 0.47 | 19.75 | 4.72 | 0.05 | 0 | 317.01 | 359.690666 | 85.91 | 0.00 | 20.640 | 0.0 | 24.810 | EAK807 |
| 5519 | 41.93 | 0.00 | 21.09 | 3.22 | 8.79 | 0.37 | 19.48 | 4.80 | 0.07 | 0 | 317.01 | 0.000000 | 85.91 | 0.00 | 20.640 | 0.0 | 24.810 | EAK807 |
5520 rows × 18 columns
Calculating T from Ryan_1996
[4]:
T = pt.calculate_gt_only_temp(gt_comps = my_input_gt,
        equationT = 'T_Ryan1996') #Calculating T_Ryan1996
T
[4]:
0        879.394511
1        899.055711
2        899.055711
3        902.455158
4        903.203904
           ...
5515    2080.727200
5516    2270.048658
5517    2270.048658
5518    2394.856217
5519    2394.856217
Length: 5520, dtype: float64
Calculating P from Ryan 1996
[5]:
P = pt.calculate_gt_only_press_temp(gt_comps = my_input_gt, equationP = 'P_Ryan1996',
                        equationT = 'T_Ryan1996')
P
[5]:
0       21.997736
1       34.305015
2       35.574086
3       28.746510
4       22.092332
          ...
5515    41.244365
5516    21.231356
5517    20.578851
5518    84.851620
5519    84.191790
Length: 5520, dtype: float64
Sudholz et al. 2021
[6]:
#Loading data from Sudholz et al. (2021) for benchmarking tests of
#Sudholz2021 and Canil1999. This file consists both the solution and composition data
file_sudholz = "PT_Sudholz.xlsx"
data_sudholz = pt.import_excel(file_sudholz, sheet_name = "PT_Sudholz")
input_sudholz_ext = data_sudholz['my_input']
[7]:
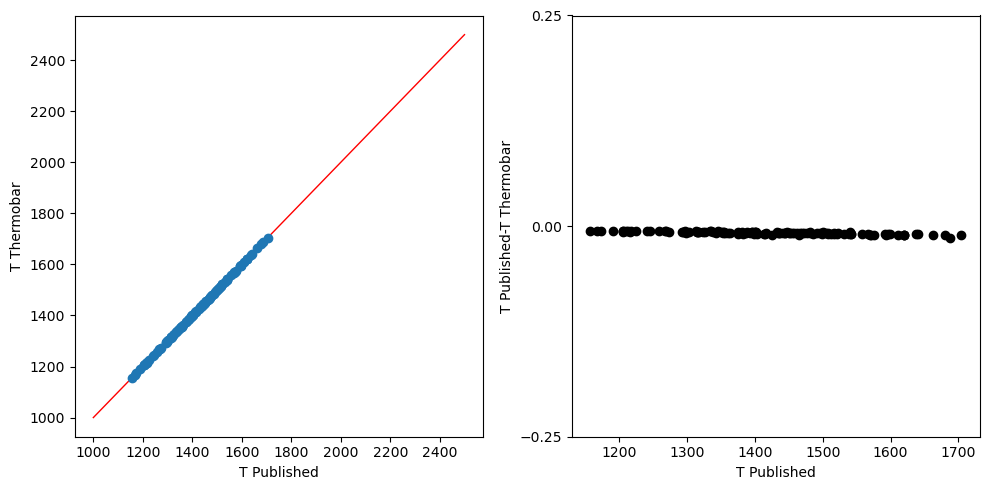
T2 = pt.calculate_gt_only_temp(gt_comps = input_sudholz_ext, equationT = 'T_Sudholz2021')
[8]:
t_ext=input_sudholz_ext['T_Sudholz']+273.15
#Creating fig object
fig, (ax1, ax2) = plt.subplots(1, 2, figsize=(10,5))

ax1.plot([1000, 2500], [1000, 2500],color = 'r',linewidth = 1)


#plotting calculated vs read T_Ryan1996
ax1.plot(t_ext,T2, 'o')

ax2.plot(t_ext, t_ext-T2, 'ok')
ax2.set_yticks([-0.25, 0, 0.25])

ax1.set_ylabel('T Thermobar')
ax1.set_xlabel('T Published')


ax2.set_ylabel('T Published-T Thermobar')
ax2.set_xlabel('T Published')
fig.tight_layout()
Canil et al. 1999
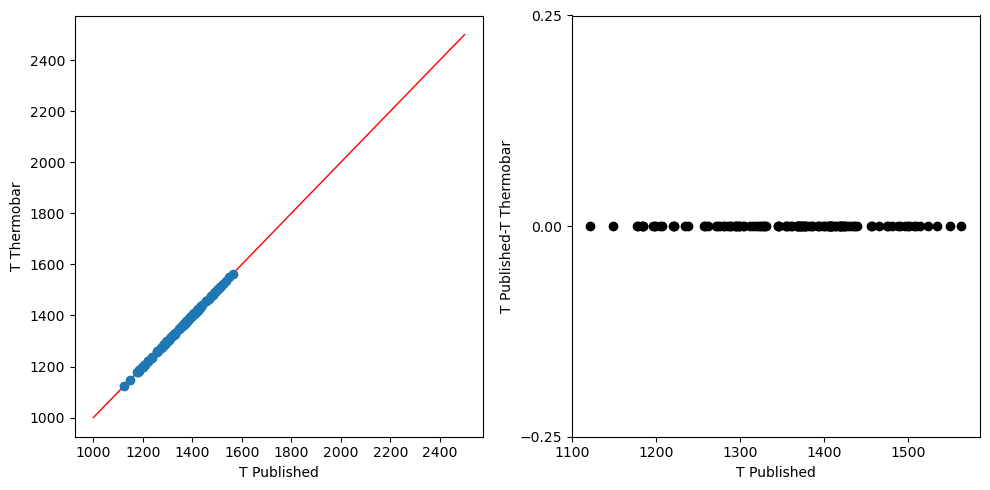
[9]:
T3 = pt.calculate_gt_only_temp(gt_comps = input_sudholz_ext, equationT = 'T_Canil1999')
[10]:
t_ext=input_sudholz_ext['T_Canil']+273
#Creating fig object
fig, (ax1, ax2) = plt.subplots(1, 2, figsize=(10,5))

ax1.plot([1000, 2500], [1000, 2500],color = 'r',linewidth = 1)


#plotting calculated vs read T_Ryan1996
ax1.plot(t_ext,T3, 'o')

ax2.plot(t_ext, t_ext-T3, 'ok')
ax2.set_yticks([-0.25, 0, 0.25])

ax1.set_ylabel('T Thermobar')
ax1.set_xlabel('T Published')


ax2.set_ylabel('T Published-T Thermobar')
ax2.set_xlabel('T Published')
fig.tight_layout()
Example of plotting functions
[11]:
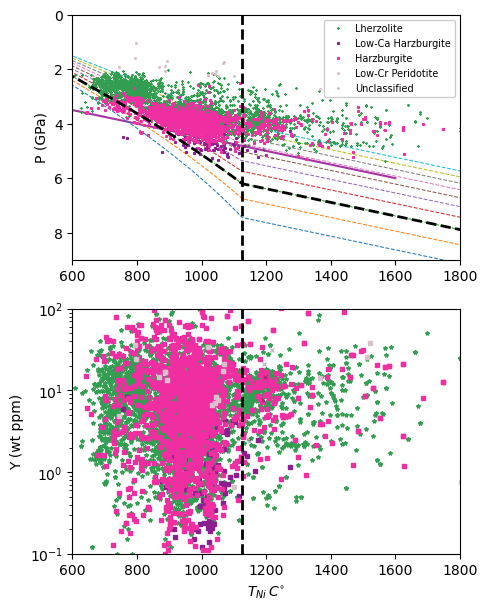
#These are not benchmarking tests but an example for plotting functions

#Recalculating T and P
T = pt.calculate_gt_only_temp(gt_comps = my_input_gt,
        equationT = 'T_Ryan1996') #Calculating T_Ryan1996
P = pt.calculate_gt_only_press_temp(gt_comps = my_input_gt, equationP = 'P_Ryan1996',
                        equationT = 'T_Ryan1996')

#Plotting garnet geotherm with BDTL and chosen geotherm of 37 mW/m^2
pt.plot_garnet_geotherm(gt_comps = my_input_gt, T_Ni = T, P_Cr = P, BDL_T = 1125,
 SHF_low = 35, SHF_high = 45, SHF_chosen = 37, max_depth = 300,
  temp_unit = 'Celsius', plot_type = 'show')
[12]:
my_input_gt = data['my_input']
[13]:
my_input_gt
[13]:
| Sample_ID_Gt | SiO2_Gt | TiO2_Gt | Al2O3_Gt | Cr2O3_Gt | FeOt_Gt | MnO_Gt | MgO_Gt | CaO_Gt | Na2O_Gt | Ti_Gt | Ni_Gt | Zn_Gt | Ga_Gt | Sr_Gt | Y_Gt | Zr_Gt | K2O_Gt | |
|---|---|---|---|---|---|---|---|---|---|---|---|---|---|---|---|---|---|---|
| 0 | 173/034/0021/2 | 41.92 | 0.03 | 21.83 | 2.73 | 8.91 | 0.51 | 18.18 | 5.34 | 0.00 | 179.845333 | 7.04 | 2.31 | 2.110 | NaN | 10.830 | 1.20 | 0 |
| 1 | EAK807 | 41.46 | 0.10 | 18.27 | 6.33 | 6.60 | 0.38 | 20.05 | 5.85 | 0.02 | 599.484443 | 8.03 | 0.00 | 0.337 | NaN | 2.091 | 14.74 | 0 |
| 2 | EAK807 | 40.99 | 0.00 | 18.37 | 7.07 | 6.75 | 0.24 | 19.91 | 5.68 | 0.00 | 0.000000 | 8.03 | 0.00 | 0.337 | NaN | 2.091 | 14.74 | 0 |
| 3 | 173/033/K069/10 | 42.78 | 0.21 | 20.67 | 3.08 | 6.90 | 0.28 | 21.76 | 4.58 | 0.00 | 1258.917331 | 8.21 | 15.64 | 6.120 | NaN | 2.390 | 20.11 | 0 |
| 4 | 173/034/0021/2 | 42.32 | 0.03 | 22.22 | 2.51 | 9.41 | 0.51 | 19.03 | 5.18 | 0.12 | 179.845333 | 8.25 | 5.89 | 2.220 | NaN | 9.440 | 5.01 | 0 |
| ... | ... | ... | ... | ... | ... | ... | ... | ... | ... | ... | ... | ... | ... | ... | ... | ... | ... | ... |
| 5515 | EAK807 | 41.96 | 0.00 | 19.88 | 4.73 | 6.59 | 0.27 | 21.07 | 4.83 | 0.00 | 0.000000 | 227.10 | 0.00 | 3.860 | NaN | 0.755 | 18.40 | 0 |
| 5516 | EAK807 | 42.90 | 0.01 | 20.40 | 4.01 | 7.10 | 0.40 | 20.61 | 5.09 | 0.01 | 59.948444 | 280.75 | 0.00 | 7.900 | NaN | 2.340 | 78.03 | 0 |
| 5517 | EAK807 | 41.85 | 0.00 | 20.84 | 3.91 | 6.81 | 0.23 | 21.23 | 4.95 | 0.04 | 0.000000 | 280.75 | 0.00 | 7.900 | NaN | 2.340 | 78.03 | 0 |
| 5518 | EAK807 | 41.12 | 0.06 | 20.68 | 3.15 | 8.96 | 0.47 | 19.75 | 4.72 | 0.05 | 359.690666 | 317.01 | 0.00 | 20.640 | NaN | 24.810 | 85.91 | 0 |
| 5519 | EAK807 | 41.93 | 0.00 | 21.09 | 3.22 | 8.79 | 0.37 | 19.48 | 4.80 | 0.07 | 0.000000 | 317.01 | 0.00 | 20.640 | NaN | 24.810 | 85.91 | 0 |
5520 rows × 18 columns
[14]:
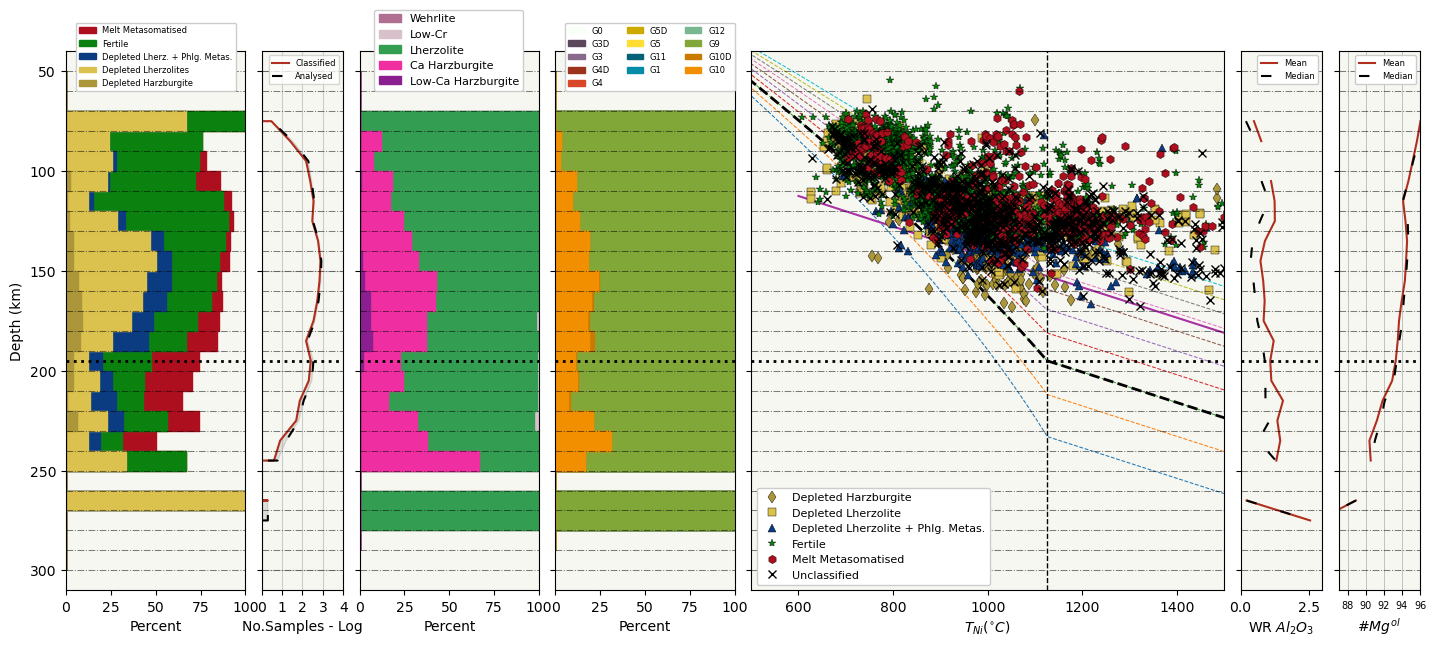
#Plotting the garnet composition of CARP, CaO-Cr2O3 and Grütter2004 classifications and projecting them unto the
#decided continental geotherm constructed with SHF_chosen and BDL_T.
#SHF_low and SHF_high are used to plot geotherms of all SHF values varying with 1 increments.
#Depth inverval is to slice up the mantle in kms when plotting compositional sections.
pt.plot_garnet_composition_section(gt_comps = my_input_gt, depth_interval = 10,
min_section_depth = 50, max_section_depth = 300, T_Ni = T, P_Cr = P, BDL_T = 1125,
 SHF_low = 35, SHF_high = 45, SHF_chosen = 37, temp_unit = 'Celsius',
 plot_type = 'save', filename_save = 'CARP_plot_2')
WARNING
Na2O component is missing in some of the samples, diamondiferious classificatons might be wrong, defaulting to non-indicator classification. idx list:
[185, 217, 2058, 2348, 2349, 2440, 2698, 2721, 2722, 2764, 2786, 2842, 2889, 2915, 2953, 2954, 3020, 3034, 3035, 3036, 3063, 3083, 3097, 3115, 3116, 3160, 3161, 3198, 3298, 3344, 3345, 3427, 3472, 3494, 3565, 3611, 3670, 3688, 3707, 3808, 3818, 3864, 3877, 3878, 3890, 3933, 3934, 3935, 3936, 3951, 3985, 3986, 4018, 4028, 4058, 4076, 4159, 4160, 4161, 4177, 4236, 4284, 4297, 4327, 4361, 4362, 4368, 4417, 4439, 4455, 4525, 4540, 4602, 4719, 5022, 5040, 5060, 5078, 5080, 5086, 5091, 5106, 5144, 5168, 5193, 5198, 5199, 5206, 5221, 5229, 5239, 5295, 5301, 5312, 5318, 5337, 5342, 5343, 5358, 5360, 5379, 5393, 5395, 5406, 5412, 5425, 5426, 5436, 5437, 5461, 5471, 5483]
C:\Users\penny\anaconda3\lib\site-packages\numpy\core\fromnumeric.py:3440: RuntimeWarning: Mean of empty slice.
  return _methods._mean(a, axis=axis, dtype=dtype,
[14]:
<module 'matplotlib.pyplot' from 'C:\\Users\\penny\\anaconda3\\lib\\site-packages\\matplotlib\\pyplot.py'>
[ ]:
[ ]: