This page was generated from
docs/Examples/Mineral_Eq_Contents_from_LLD/Calculating_Eq_Min_Contents.ipynb.
Interactive online version:
![]() .
.
Calculating equilibrium mineral contents from a liquid line of descent
Here, we are using the liquid results from a Petrolog3 fractional crystallizatoin model (Liu et al. in prep)
Yes, you can get mineral compositions from Petrolog3 directly, but this allows you to use more up-to-date models for mineral compositions
We wish to calculate the equilibrium An of Plag, Mg# of Cpx, and Fo of olivine at each step along the fractionation path, to compare to the mineral compositions we observe sulfides in.
You can download the Excel spreadsheet here: https://github.com/PennyWieser/Thermobar/blob/main/docs/Examples/Mineral_Eq_Contents_from_LLD/Petrolog_FC_Path.xlsx
First, pip install Thermobar if you haven’t already
[1]:
#!pip install Thermobar
[2]:
import numpy as np
import pandas as pd
import Thermobar as pt
import matplotlib.pyplot as plt
import matplotlib as mpl
from matplotlib import cm
import warnings as w
pd.options.display.max_columns = None
from matplotlib import patches
print('Thermobar version')
print(pt.__version__)
Thermobar version
1.0.13
[3]:
# Set some plotting parameters
plt.style.use("seaborn-colorblind")
plt.rcParams["font.family"] = 'arial'
plt.rcParams["font.size"] =12
plt.rcParams["mathtext.default"] = "regular"
plt.rcParams["mathtext.fontset"] = "dejavusans"
plt.rcParams['patch.linewidth'] = 1
plt.rcParams['axes.linewidth'] = 1
plt.rcParams["xtick.direction"] = "in"
plt.rcParams["ytick.direction"] = "in"
plt.rcParams["ytick.direction"] = "in"
plt.rcParams["xtick.major.size"] = 6 # Sets length of ticks
plt.rcParams["ytick.major.size"] = 4 # Sets length of ticks
plt.rcParams["ytick.labelsize"] = 12 # Sets size of numbers on tick marks
plt.rcParams["xtick.labelsize"] = 12 # Sets size of numbers on tick marks
plt.rcParams["axes.titlesize"] = 14 # Overall title
plt.rcParams["axes.labelsize"] = 14 # Axes labels
Import your liquid compositions extracted from Petrolog into the thermobar format
[14]:
In=pt.import_excel('Model9_BaliOnlyLang_Closedsystem_32kbar_NiCu_02.xlsx', sheet_name='Thermobar_input')
In_all=In['my_input']
Liqs=In['Liqs']
Liqs['T_K']=In_all['Temperature']+273.15
Check they have read in correctly
[15]:
Liqs.head()
[15]:
| SiO2_Liq | TiO2_Liq | Al2O3_Liq | FeOt_Liq | MnO_Liq | MgO_Liq | CaO_Liq | Na2O_Liq | K2O_Liq | Cr2O3_Liq | P2O5_Liq | H2O_Liq | Fe3Fet_Liq | NiO_Liq | CoO_Liq | CO2_Liq | Sample_ID_Liq | T_K | |
|---|---|---|---|---|---|---|---|---|---|---|---|---|---|---|---|---|---|---|
| 0 | 48.8740 | 0.7872 | 16.3903 | 7.639650 | 0.1413 | 10.1312 | 14.0169 | 1.5745 | 0.0606 | 0.0505 | 0.0606 | 0.1514 | 0.099972 | 0.0 | 0.0 | 0.0 | step1 | 1519.900 |
| 1 | 48.8315 | 0.7924 | 16.5133 | 7.681599 | 0.1427 | 10.0416 | 13.9595 | 1.5885 | 0.0612 | 0.0510 | 0.0612 | 0.1529 | 0.100422 | 0.0 | 0.0 | 0.0 | step2 | 1516.869 |
| 2 | 48.7880 | 0.7977 | 16.6394 | 7.724217 | 0.1442 | 9.9486 | 13.9595 | 1.6030 | 0.0618 | 0.0515 | 0.0618 | 0.1545 | 0.100893 | 0.0 | 0.0 | 0.0 | step3 | 1513.763 |
| 3 | 48.7442 | 0.8031 | 16.7661 | 7.766625 | 0.1457 | 9.8541 | 13.8460 | 1.6175 | 0.0624 | 0.0520 | 0.0624 | 0.1561 | 0.101373 | 0.0 | 0.0 | 0.0 | step4 | 1510.643 |
| 4 | 48.6995 | 0.8085 | 16.8958 | 7.809603 | 0.1472 | 9.7561 | 13.7900 | 1.6325 | 0.0631 | 0.0526 | 0.0631 | 0.1577 | 0.101875 | 0.0 | 0.0 | 0.0 | step5 | 1507.448 |
We need a temperature for many models
Lets calculate temperature from Sugawara (2000) for these liquids
[10]:
Temp_Sugawara=pt.calculate_liq_only_temp(liq_comps=Liqs, equationT="T_Sug2000_eq3_ol", P=3.2)
Calculate equilibrum An contents using a variety of models
[16]:
Eq_Plag_PET=pt.calculate_eq_plag_An_number(liq_comps=Liqs,
                                           P=3.2, T=Liqs['T_K'], An_model='All')
Eq_Plag_PET.head()
C:\Users\penny\anaconda3\lib\site-packages\pandas\core\indexing.py:2120: FutureWarning: In a future version, the Index constructor will not infer numeric dtypes when passed object-dtype sequences (matching Series behavior)
  new_ix = Index(new_ix)
[16]:
| Pred_An_EqE_P2005 | Pred_Ab_EqF_P2005 | Pred_Or_EqG_P2005 | An_Eq_Thermo_eq31_N2011 | An_Eq_best_non-thermo_choice_N2011 | Selected non-thermo model_N2011 | An_Eq_Mafic_Ultramafic_eq33_N2011 | An_Eq_Alk_Mafic_Ultramafic_eq34_N2011 | An_Eq_Int_Fels_eq35_N2011 | |
|---|---|---|---|---|---|---|---|---|---|
| 0 | 0.972385 | 0.162066 | 0.000681 | 0.877241 | 0.871935 | Maf_Ultra | 0.871935 | 0.931702 | 0.858161 |
| 1 | 0.964467 | 0.160990 | 0.000688 | 0.876693 | 0.874646 | Maf_Ultra | 0.874646 | 0.935738 | 0.855441 |
| 2 | 0.958145 | 0.158753 | 0.000690 | 0.876482 | 0.877657 | Maf_Ultra | 0.877657 | 0.939205 | 0.853747 |
| 3 | 0.948686 | 0.158728 | 0.000701 | 0.875317 | 0.880166 | Maf_Ultra | 0.880166 | 0.943627 | 0.850020 |
| 4 | 0.940819 | 0.157542 | 0.000708 | 0.874481 | 0.882969 | Maf_Ultra | 0.882969 | 0.947466 | 0.847326 |
Calculate equilibrium Ol Fo contents, using all available models.
[17]:
Eq_Ol_PET=pt.calculate_eq_ol_content(liq_comps=Liqs, Kd_model="All",T=Liqs['T_K'], P=3.2)
Eq_Ol_PET.head()
[17]:
| Mg#_Liq_Fe2 | Mg#_Liq_Fet | Eq Fo (Shea, Kd=0.335) | Eq Fo (Shea, Kd=0.325) | Eq Fo (Shea, Kd=0.345) | Eq Fo (Roeder, Kd=0.3) | Eq Fo (Roeder, Kd=0.33) | Eq Fo (Roeder, Kd=0.27) | Eq Fo (Matzen, Kd=0.34) | Eq Fo (Matzen, Kd=0.352) | Eq Fo (Matzen, Kd=0.328) | Kd (Toplis, Iter) | Eq Fo (Toplis, Iter) | Eq Fo (Putirka 8a Fe2, Kd=0.33) | Eq Fo (Putirka 8a Fe2, Kd=0.33-0.044) | Eq Fo (Putirka 8a Fe2, Kd=0.33+0.044) | Calc Kd (Putirka 8c, Fe2) | Eq Fo (Putirka 8c Fe2) | Eq Fo (Putirka 9a Fet, Kd=0.29) | Eq Fo (Putirka 9a Fet, Kd=0.29-0.051) | Eq Fo (Putirka 9a Fet, Kd=0.29+0.051) | Calc Kd (Putirka 8b, Fe2) | Eq Fo (Putirka 8b Fe2) | |
|---|---|---|---|---|---|---|---|---|---|---|---|---|---|---|---|---|---|---|---|---|---|---|---|
| 0 | 0.724248 | 0.702724 | 0.886880 | 0.883895 | 0.889885 | 0.897487 | 0.888380 | 0.906782 | 0.885385 | 0.881818 | 0.888981 | 0.310429 | 0.894300 | 0.888380 | 0.901801 | 0.875352 | 0.337099 | 0.886252 | 0.890726 | 0.908179 | 0.908179 | 0.333775 | 0.887247 |
| 1 | 0.721472 | 0.699716 | 0.885482 | 0.882465 | 0.888519 | 0.896205 | 0.886998 | 0.905604 | 0.883971 | 0.880366 | 0.887606 | 0.310122 | 0.893077 | 0.886998 | 0.900567 | 0.873832 | 0.337007 | 0.884875 | 0.889321 | 0.906974 | 0.906974 | 0.333651 | 0.885890 |
| 2 | 0.718586 | 0.696589 | 0.884022 | 0.880972 | 0.887094 | 0.894866 | 0.885555 | 0.904374 | 0.882495 | 0.878850 | 0.886170 | 0.309649 | 0.891850 | 0.885555 | 0.899278 | 0.872245 | 0.336912 | 0.883438 | 0.887852 | 0.905715 | 0.905715 | 0.333524 | 0.884474 |
| 3 | 0.715648 | 0.693405 | 0.882529 | 0.879445 | 0.885635 | 0.893495 | 0.884079 | 0.903114 | 0.880984 | 0.877299 | 0.884701 | 0.309499 | 0.890492 | 0.884079 | 0.897958 | 0.870623 | 0.336817 | 0.881967 | 0.886347 | 0.904424 | 0.904424 | 0.333396 | 0.883026 |
| 4 | 0.712595 | 0.690097 | 0.880970 | 0.877851 | 0.884111 | 0.892063 | 0.882538 | 0.901797 | 0.879407 | 0.875680 | 0.883166 | 0.309183 | 0.889126 | 0.882538 | 0.896580 | 0.868929 | 0.336719 | 0.880432 | 0.884775 | 0.903075 | 0.903075 | 0.333265 | 0.881513 |
Calculate equilibrium Pyroxene Mg#s using the Putirka 2005 eq 35 expression
[24]:
Eq_Cpx_PET=pt.calculate_eq_cpx_Mg_number(liq_comps=Liqs,  Kd_model="Putirka2008", T=Liqs['T_K'])
Eq_Cpx_PET.head()
[24]:
| Eq Mg# (Putirka 2008, Fe2) | Eq Mg# (Putirka 2008 -0.08, Fe2) | Eq Mg# (Putirka 2008 +0.08, Fe2) | Eq Mg# (Putirka 2008, Fet) | Eq Mg# (Putirka 2008 -0.08, Fet) | Eq Mg# (Putirka 2008 +0.08, Fet) | |
|---|---|---|---|---|---|---|
| 0 | 0.900575 | 0.840053 | 0.970495 | 0.890738 | 0.831487 | 0.959081 |
| 1 | 0.899531 | 0.839145 | 0.969284 | 0.889555 | 0.830456 | 0.957710 |
| 2 | 0.898443 | 0.838197 | 0.968020 | 0.888319 | 0.829379 | 0.956278 |
| 3 | 0.897330 | 0.837228 | 0.966728 | 0.887056 | 0.828278 | 0.954814 |
| 4 | 0.896168 | 0.836217 | 0.965380 | 0.885737 | 0.827127 | 0.953285 |
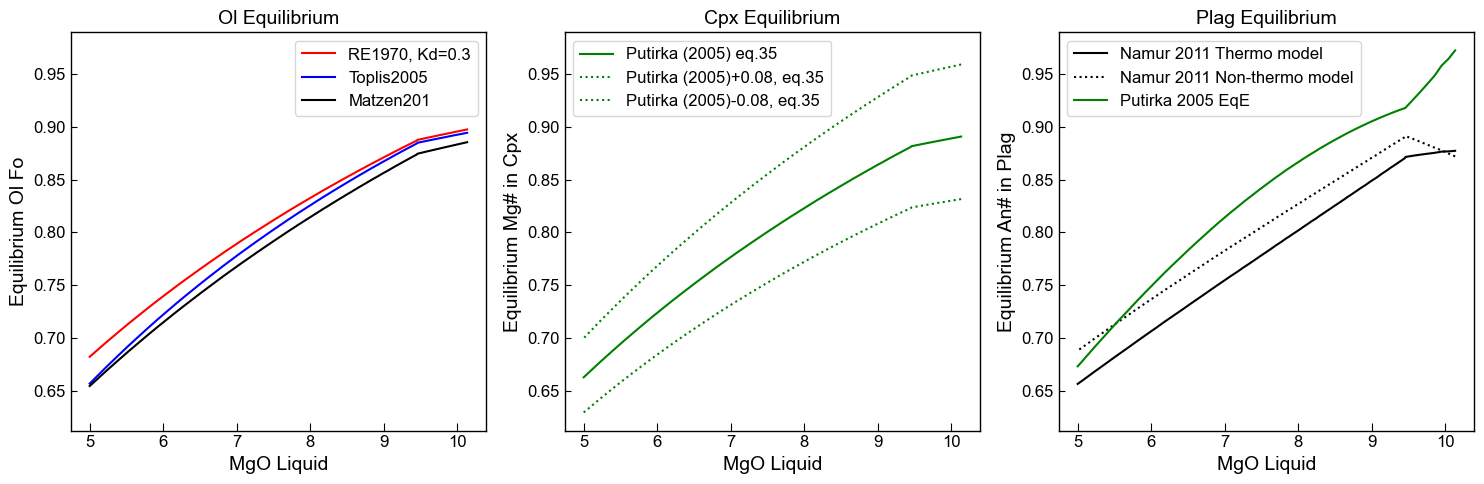
Plot changes against MgO content in the liquid
[25]:
fig, (ax1, ax2, ax3) = plt.subplots(1, 3, figsize=(15,5), sharey=True)
ax1.set_title('Ol Equilibrium')
ax1.plot(Liqs['MgO_Liq'], Eq_Ol_PET['Eq Fo (Roeder, Kd=0.3)'], '-r', label='RE1970, Kd=0.3')
ax1.plot(Liqs['MgO_Liq'], Eq_Ol_PET['Eq Fo (Toplis, Iter)'], '-b', label='Toplis2005')
ax1.plot(Liqs['MgO_Liq'], Eq_Ol_PET['Eq Fo (Matzen, Kd=0.34)'], '-k', label='Matzen201')

ax1.set_xlabel('MgO Liquid')
ax1.set_ylabel('Equilibrium Ol Fo')
ax1.legend()
ax2.set_title('Cpx Equilibrium')
ax2.plot(Liqs['MgO_Liq'], Eq_Cpx_PET['Eq Mg# (Putirka 2008, Fet)'],
         '-g', label='Putirka (2005) eq.35')
ax2.plot(Liqs['MgO_Liq'], Eq_Cpx_PET['Eq Mg# (Putirka 2008 +0.08, Fet)'],
         ':g', label='Putirka (2005)+0.08, eq.35')
ax2.plot(Liqs['MgO_Liq'], Eq_Cpx_PET['Eq Mg# (Putirka 2008 -0.08, Fet)'],
         ':g', label='Putirka (2005)-0.08, eq.35')
ax2.set_xlabel('MgO Liquid')
ax2.set_ylabel('Equilibrium Mg# in Cpx')
ax2.legend()
ax2.yaxis.set_tick_params(which='both', labelbottom=True)

ax3.set_title('Plag Equilibrium')
ax3.plot(Liqs['MgO_Liq'], Eq_Plag_PET['An_Eq_Thermo_eq31_N2011'],
         '-k', label='Namur 2011 Thermo model')
ax3.plot(Liqs['MgO_Liq'], Eq_Plag_PET['An_Eq_best_non-thermo_choice_N2011'],
         ':k', label='Namur 2011 Non-thermo model')
ax3.plot(Liqs['MgO_Liq'], Eq_Plag_PET['Pred_An_EqE_P2005'],
         '-g', label='Putirka 2005 EqE')
ax3.set_xlabel('MgO Liquid')
ax3.set_ylabel('Equilibrium An# in Plag')
ax3.legend()
ax3.yaxis.set_tick_params(which='both', labelbottom=True)
fig.tight_layout()
An example of a specific application
We have observed sulfides touching/enclosed within Plag, Cpx and Olivine grains. We have also modelled sulfide saturation, so we know the approximate MgO that sulfides should come on the liquidus (~8 wt%).
We want to work out at what approximate MgO each crystal grew. So if sulfides appear in Cpx compositions that are in equilibrium with 8 wt% MgO liquids, we know our sulfide saturation model works. If they appear in crystals that grew at 10 wt% MgO, we have predicted the onset of sulfide saturation a bit late. If they appear at 6 wt% MgO, its a bit early
First, we read in the mineral data, each mineral has a sulfide next to it
[26]:
Plags=pt.import_excel('Petrolog_FC_Path.xlsx',
                      sheet_name='Plag_with_Sulf', suffix="_Plag").get('Plags')
Cpxs=pt.import_excel('Petrolog_FC_Path.xlsx',
                     sheet_name='Cpx_with_Sulf', suffix="_Cpx").get('Cpxs')
Ols=pt.import_excel('Petrolog_FC_Path.xlsx',
                    sheet_name='Ol_with_Sulf', suffix="_Ol").get('Ols')

# And matrix glasses
MG=pt.import_excel('Petrolog_FC_Path.xlsx',
                   sheet_name='Matrix_Glasses', suffix="_Liq").get('Liqs')
Then we calculate An contents, Mg#s, and Fo contents for these
[27]:
Plag_An=pt.calculate_cat_fractions_plagioclase(plag_comps=Plags).get('An_Plag')
Cpx_Mgno=pt.calculate_cpx_mgno(cpx_comps=Cpxs)
Ol_Fo=pt.calculate_ol_fo(ol_comps=Ols)
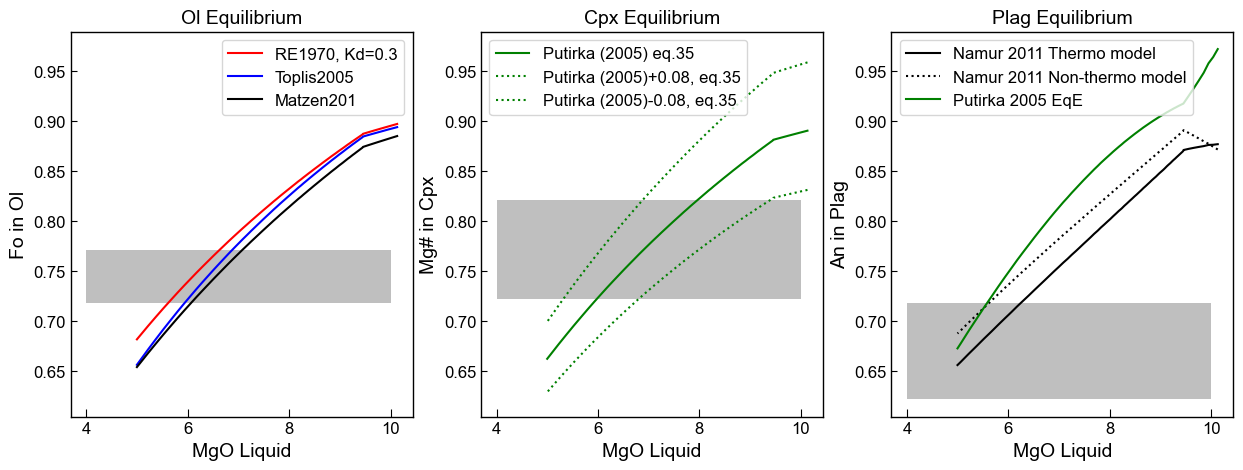
We can plot these ontop of our equilibrium curves
[28]:
fig, (ax1, ax2, ax3) = plt.subplots(1, 3, figsize=(15,5), sharey=True)
# xmin_MgO=np.min(MG['MgO_Liq'])
# xmax_MgO=np.max(MG['MgO_Liq'])
xmin_MgO=4
xmax_MgO=10

#################################
ax1.set_title('Ol Equilibrium')

ax1.plot(Liqs['MgO_Liq'], Eq_Ol_PET['Eq Fo (Roeder, Kd=0.3)'], '-r', label='RE1970, Kd=0.3')
ax1.plot(Liqs['MgO_Liq'], Eq_Ol_PET['Eq Fo (Toplis, Iter)'], '-b', label='Toplis2005')
ax1.plot(Liqs['MgO_Liq'], Eq_Ol_PET['Eq Fo (Matzen, Kd=0.34)'], '-k', label='Matzen201')
ymin_ol=np.nanmin(Ol_Fo)
ymax_ol=np.nanmax(Ol_Fo)
rect_ol=patches.Rectangle((xmin_MgO, ymin_ol), (xmax_MgO-xmin_MgO), (ymax_ol-ymin_ol),
                           lw=1, ec="None", facecolor='grey', alpha=0.5)
ax1.add_patch(rect_ol)
ax1.set_xlabel('MgO Liquid')
ax1.set_ylabel('Fo in Ol')
ax1.legend()

#######################################
ymin_cpx=np.nanmin(Cpx_Mgno)
ymax_cpx=np.nanmax(Cpx_Mgno)
rect_cpx=patches.Rectangle((xmin_MgO, ymin_cpx), (xmax_MgO-xmin_MgO), (ymax_cpx-ymin_cpx),
                           lw=1, ec="None", facecolor='grey', alpha=0.5)
ax2.add_patch(rect_cpx)

ax2.set_title('Cpx Equilibrium')
ax2.plot(Liqs['MgO_Liq'], Eq_Cpx_PET['Eq Mg# (Putirka 2008, Fet)'],
         '-g', label='Putirka (2005) eq.35')
ax2.plot(Liqs['MgO_Liq'], Eq_Cpx_PET['Eq Mg# (Putirka 2008 +0.08, Fet)'],
         ':g', label='Putirka (2005)+0.08, eq.35')
ax2.plot(Liqs['MgO_Liq'], Eq_Cpx_PET['Eq Mg# (Putirka 2008 -0.08, Fet)'],
         ':g', label='Putirka (2005)-0.08, eq.35')
ax2.set_xlabel('MgO Liquid')
ax2.set_ylabel('Mg# in Cpx')
ax2.legend()
ax2.yaxis.set_tick_params(which='both', labelbottom=True)

###############################################

ymin_plag=np.nanmin(Plag_An)
ymax_plag=np.nanmax(Plag_An)
rect_plag=patches.Rectangle((xmin_MgO, ymin_plag), (xmax_MgO-xmin_MgO), (ymax_plag-ymin_plag),
                           lw=1, ec="None", facecolor='grey', alpha=0.5)
ax3.add_patch(rect_plag)
ax3.set_title('Plag Equilibrium')
ax3.plot(Liqs['MgO_Liq'], Eq_Plag_PET['An_Eq_Thermo_eq31_N2011'],
         '-k', label='Namur 2011 Thermo model')
ax3.plot(Liqs['MgO_Liq'], Eq_Plag_PET['An_Eq_best_non-thermo_choice_N2011'],
         ':k', label='Namur 2011 Non-thermo model')
ax3.plot(Liqs['MgO_Liq'], Eq_Plag_PET['Pred_An_EqE_P2005'],
         '-g', label='Putirka 2005 EqE')
ax3.set_xlabel('MgO Liquid')
ax3.set_ylabel('An in Plag')
ax3.legend(loc='upper left')
ax3.yaxis.set_tick_params(which='both', labelbottom=True)
Using known redox states to assess equilibrium
While above we used inputted Fe3Fet_Liq ratios from petrolog, we can also calculate them relative to a buffer using Thermobar
First, calculate Glass temperature, as buffer pos is T sensitive
[29]:
Temp_Sugawara_MG=pt.calculate_liq_only_temp(liq_comps=MG, equationT="T_Sug2000_eq3_ol", P=3.2)
Calculate Glass Fe3FeT from redox (FMQ+0.2, Bali et al. 2018)
[34]:
Fe3Fet_MG_calc=pt.convert_fo2_to_fe_partition(liq_comps=MG, T_K=Liqs['T_K'], P_kbar=3.2,
model="Kress1991", fo2="QFM", renorm=False, fo2_offset=0.2).get('Fe3Fet_Liq')
Then we calculate Eq contents of each mineral for the matrix glasses
[35]:
Eq_Plag_MG=pt.calculate_eq_plag_An_number(liq_comps=MG, P=3.2, T=Liqs['T_K'], An_model='All')


Eq_Ol_MG=pt.calculate_eq_ol_content(liq_comps=MG, Kd_model="All",T=Liqs['T_K'], P=3.2,
                                    Fe3Fet_Liq=Fe3Fet_MG_calc)


Eq_Cpx_MG=pt.calculate_eq_cpx_Mg_number(liq_comps=MG,
Fe3Fet_Liq=Fe3Fet_MG_calc, Kd_model="Putirka2008", T=Liqs['T_K'])
C:\Users\penny\anaconda3\lib\site-packages\pandas\core\indexing.py:2120: FutureWarning: In a future version, the Index constructor will not infer numeric dtypes when passed object-dtype sequences (matching Series behavior)
  new_ix = Index(new_ix)
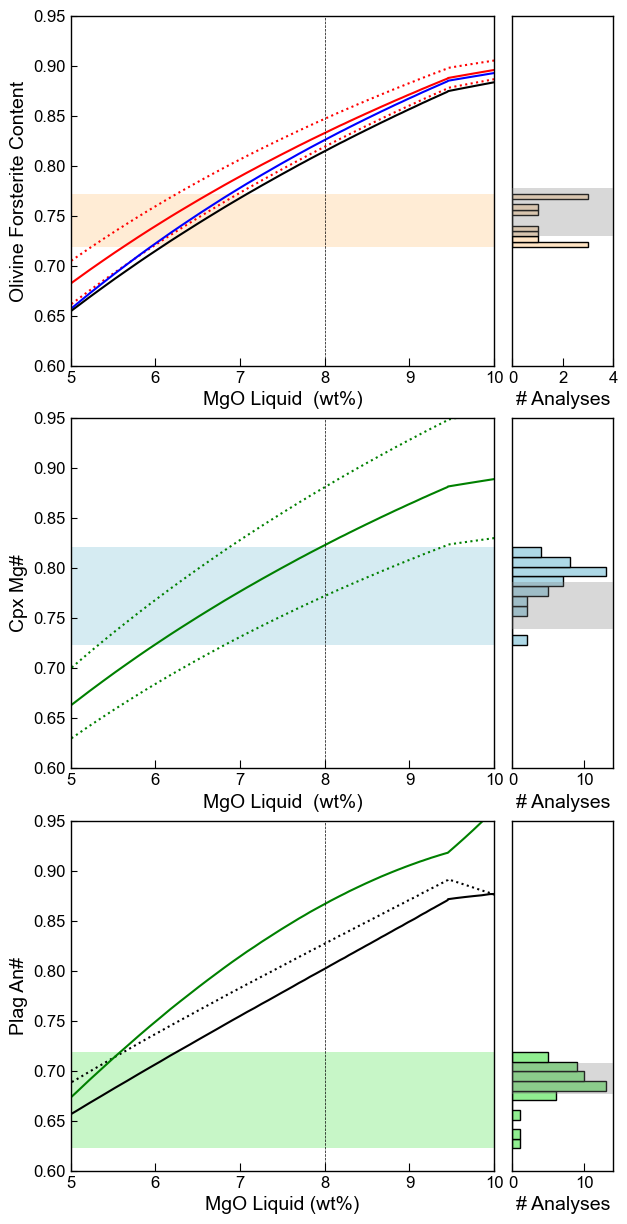
Vertically stacked graph with histograms on the side
We can also display the models relative to real data as histograms on the side
[36]:
# fig, (ax1, ax2, ax3) = plt.subplots(1, 3, figsize=(15,5), sharey=True)
fig, (((ax1a),(ax1b)), ((ax2a), (ax2b)), ((ax3a), (ax3b))) = plt.subplots(3, 2,
                        figsize=(7,15),gridspec_kw={'width_ratios': [4.2, 1]}, sharey=True)
plt.subplots_adjust(wspace=0.07, hspace=0.15)
# xmin_MgO=np.min(MG['MgO_Liq'])
# xmax_MgO=np.max(MG['MgO_Liq'])
xmin_MgO=4
xmax_MgO=10

#################################

ax1a.plot(Liqs['MgO_Liq'], Eq_Ol_PET['Eq Fo (Roeder, Kd=0.3)'], '-r', label='RE1970, Kd=0.3')
ax1a.plot(Liqs['MgO_Liq'], Eq_Ol_PET['Eq Fo (Roeder, Kd=0.33)'], ':r', label='RE1970, Kd=0.3')
ax1a.plot(Liqs['MgO_Liq'], Eq_Ol_PET['Eq Fo (Roeder, Kd=0.27)'], ':r', label='RE1970, Kd=0.3')

ax1a.plot(Liqs['MgO_Liq'], Eq_Ol_PET['Eq Fo (Toplis, Iter)'], '-b', label='Toplis2005')
ax1a.plot(Liqs['MgO_Liq'], Eq_Ol_PET['Eq Fo (Matzen, Kd=0.34)'], '-k', label='Matzen201')
ymin_ol=np.nanmin(Ol_Fo)
ymax_ol=np.nanmax(Ol_Fo)
rect_ol=patches.Rectangle((xmin_MgO, ymin_ol), (xmax_MgO-xmin_MgO), (ymax_ol-ymin_ol),
                           lw=1, ec="None", facecolor='bisque', alpha=0.7)
ax1a.add_patch(rect_ol)


#######################################
ymin_cpx=np.nanmin(Cpx_Mgno)
ymax_cpx=np.nanmax(Cpx_Mgno)
rect_cpx=patches.Rectangle((xmin_MgO, ymin_cpx), (xmax_MgO-xmin_MgO), (ymax_cpx-ymin_cpx),
                           lw=1, ec="None", facecolor='lightblue', alpha=0.5)
ax2a.add_patch(rect_cpx)

ax2a.plot(Liqs['MgO_Liq'], Eq_Cpx_PET['Eq Mg# (Putirka 2008, Fet)'],
         '-g', label='Putirka (2005) eq.35')
ax2a.plot(Liqs['MgO_Liq'], Eq_Cpx_PET['Eq Mg# (Putirka 2008 +0.08, Fet)'],
         ':g', label='Putirka (2005)+0.08, eq.35')
ax2a.plot(Liqs['MgO_Liq'], Eq_Cpx_PET['Eq Mg# (Putirka 2008 -0.08, Fet)'],
         ':g', label='Putirka (2005)-0.08, eq.35')


ax2a.yaxis.set_tick_params(which='both', labelbottom=True)

###############################################

ymin_plag=np.nanmin(Plag_An)
ymax_plag=np.nanmax(Plag_An)
rect_plag=patches.Rectangle((xmin_MgO, ymin_plag), (xmax_MgO-xmin_MgO), (ymax_plag-ymin_plag),
                           lw=1, ec="None", facecolor='lightgreen', alpha=0.5)
ax3a.add_patch(rect_plag)

ax3a.plot(Liqs['MgO_Liq'], Eq_Plag_PET['An_Eq_Thermo_eq31_N2011'],
         '-k', label='Namur 2011 Thermo model')
ax3a.plot(Liqs['MgO_Liq'], Eq_Plag_PET['An_Eq_best_non-thermo_choice_N2011'],
         ':k', label='Namur 2011 Non-thermo model')
ax3a.plot(Liqs['MgO_Liq'], Eq_Plag_PET['Pred_An_EqE_P2005'],
         '-g', label='Putirka 2005 EqE')


ax3a.yaxis.set_tick_params(which='both', labelbottom=True)
###########################################################################
# Plot mineral compositions on LHS axis.
# Make a patch of the minimum and maximum An for measured matrix glasses
plag_model='An_Eq_best_non-thermo_choice_N2011'

ymin_plag=np.min(Eq_Plag_MG[plag_model])
ymax_plag=np.max(Eq_Plag_MG[plag_model])
xmin_plag=0
xmax_plag=15
rect_plag=patches.Rectangle((xmin_plag, ymin_plag), (xmax_plag-xmin_plag), (ymax_plag-ymin_plag),
                           lw=1, ec="None", facecolor='grey', alpha=0.3, zorder=100)
ax3b.add_patch(rect_plag)

# Histogram of measured Plag An contents
ax3b.hist(Plag_An, fc='lightgreen', ec='k', orientation='horizontal')


# Make a patch of the minimum and maximum Mgno for measured matrix glasses
cpx_model='Eq Mg# (Putirka 2008, Fe2)'
ymin_cpx=np.min(Eq_Cpx_MG[cpx_model])
ymax_cpx=np.max(Eq_Cpx_MG[cpx_model])
xmin_cpx=0
xmax_cpx=15
rect_cpx=patches.Rectangle((xmin_cpx, ymin_cpx), (xmax_cpx-xmin_cpx), (ymax_cpx-ymin_cpx),
                           lw=1, ec="None", facecolor='grey', alpha=0.3, zorder=100)
ax2b.add_patch(rect_cpx)


ax2b.hist(Cpx_Mgno, fc='lightblue',  orientation='horizontal', ec='k')


ol_model='Eq Fo (Roeder, Kd=0.3)'

ymin_ol=np.min(Eq_Ol_MG[ol_model])
ymax_ol=np.max(Eq_Ol_MG[ol_model])
xmin_ol=0
xmax_ol=15
rect_ol=patches.Rectangle((xmin_ol, ymin_ol), (xmax_ol-xmin_ol), (ymax_ol-ymin_ol),
                           lw=1, ec="None", facecolor='grey', alpha=0.3, zorder=100)
ax1b.add_patch(rect_ol)

ax1b.hist(Ol_Fo, fc='bisque',  orientation='horizontal', ec='k')


# Hide RHS axes

#ax1b.axes.get_xaxis().set_visible(False)
ax1b.axes.get_yaxis().set_visible(False)
#ax2b.axes.get_xaxis().set_visible(False)
ax2b.axes.get_yaxis().set_visible(False)
#ax3b.axes.get_xaxis().set_visible(False)
ax3b.axes.get_yaxis().set_visible(False)

# set all a axis
ax1a.set_xlim([5, 10])
ax2a.set_xlim([5, 10])
ax3a.set_xlim([5, 10])
# set single a y axis
ax1a.set_ylim([0.6, 0.95])
# Setting b x axis
ax1b.set_xlim([0, 4])
ax2b.set_xlim([0, 14])
ax3b.set_xlim([0, 14])
ax1b.set_ylim()
###

ax3a.set_xlabel('MgO Liquid (wt%)')
ax3a.set_ylabel('Plag An#')
#ax3a.legend(loc='upper left')

ax2a.set_xlabel('MgO Liquid  (wt%)')
ax2a.set_ylabel('Cpx Mg#')
#ax2a.legend()

ax1a.set_xlabel('MgO Liquid  (wt%)')
ax1a.set_ylabel('Olivine Forsterite Content')
#ax1a.legend()
ax1b.set_xlabel('# Analyses')
ax2b.set_xlabel('# Analyses')
ax3b.set_xlabel('# Analyses')

ax1a.plot([8, 8], [0.6, 1], '--k', zorder=100, lw=0.5)
ax2a.plot([8, 8], [0.6, 1], '--k', zorder=100, lw=0.5)
ax3a.plot([8, 8], [0.6, 1], '--k', zorder=100, lw=0.5)
fig.savefig('Mineral_Equilirium.png', dpi=300)
[ ]:
[ ]: