This page was generated from
docs/Examples/Opx_and_Opx_Liq_Thermobarometry/Opx_Liq_Thermobarometry.ipynb.
Interactive online version:
![]() .
.
Orthopyroxene-only and Liquid thermobarometry.
This notebook shows how to perform opx-only and opx-liq thermobarometry
You can download the spreadsheet with data here: https://github.com/PennyWieser/Thermobar/blob/main/docs/Examples/Opx_and_Opx_Liq_Thermobarometry/Opx_Liq_Example.xlsx
You need to install Thermobar once on your machine, if you haven’t done this yet, uncomment the line below (remove the #)
[1]:
#!pip install Thermobar
First, load the necessary python things
[2]:
import numpy as np
import pandas as pd
import matplotlib.pyplot as plt
import Thermobar as pt
Now, load the data
[3]:
out=pt.import_excel('Opx_Liq_Example.xlsx', sheet_name="Paired_Opx_Liq")
my_input=out['my_input']
Liqs=out['Liqs']
Opxs=out['Opxs']
At any point, you can do help(pt.function) to get some more information
[4]:
help(pt.calculate_opx_liq_temp)
Help on function calculate_opx_liq_temp in module Thermobar.orthopyroxene_thermobarometry:

calculate_opx_liq_temp(*, equationT, opx_comps=None, liq_comps=None, meltmatch=None, P=None, eq_tests=False, Fe3Fet_Liq=None, H2O_Liq=None)
    Orthopyroxene-Liquid thermometer, user specifies equation,
    and calculates temperature in Kelvin.  Also has option to calculate equilibrium tests.

    Parameters
    -------

    opx_comps: pandas.DataFrame
        Orthopyroxene compositions with column headings SiO2_Opx, MgO_Opx etc.

    liq_comps: pandas.DataFrame
        Liquid compositions with column headings SiO2_Liq, MgO_Liq etc.

    meltmatch: pandas.DataFrame
        Combined Opx-Liquid compositions. Used for "melt match" functionality.

    EquationT: str
        Choice of equation:
        |  T_Opx_Beatt1993
        |  T_Put2008_eq28a
        |  T_Put2008_eq28b_opx_sat


    P: float, int, pandas.Series, str  ("Solve")
        Pressure in kbar
        Only needed for P-sensitive thermometers.
        If enter P="Solve", returns a partial function
        Else, enter an integer, float, or panda series

    eq_tests: bool
        If False (default), returns temperature as a panda series
        If True, returns prsesure, Kd Fe-Mg for liq-opx,
        as well as user-entered opx and liq comps as a panda dataframe.

    Returns
    -------
    If eq_tests=False
        pandas.Series: Pressure in kbar (if eq_tests=False)
    If eq_tests=True
        pandas.DataFrame: Pressure in kbar + Kd-Fe-Mg + opx+liq comps
Alternatively, you can access the function names as well as the inputs like this:
[5]:
pt.Opx_Liq_T_funcs
[5]:
{<function Thermobar.orthopyroxene_thermobarometry.T_Beatt1993_opx(P, *, Ca_Liq_cat_frac, Fet_Liq_cat_frac, Mg_Liq_cat_frac, Mn_Liq_cat_frac, Al_Liq_cat_frac, Ti_Liq_cat_frac)>,
 <function Thermobar.orthopyroxene_thermobarometry.T_Put2008_eq28a(P, *, H2O_Liq, ln_Fm2Si2O6_liq, Mg_Liq_cat_frac, K_Liq_cat_frac, Fet_Liq_cat_frac, Fet_Opx_cat_6ox)>,
 <function Thermobar.orthopyroxene_thermobarometry.T_Put2008_eq28b_opx_sat(P, *, H2O_Liq, Mg_Liq_cat_frac, Ca_Liq_cat_frac, K_Liq_cat_frac, Mn_Liq_cat_frac, Fet_Liq_cat_frac, Fet_Opx_cat_6ox, Al_Liq_cat_frac, Ti_Liq_cat_frac, Mg_Number_Liq_NoFe3)>}
[6]:
pt.Opx_Liq_P_funcs
[6]:
{<function Thermobar.orthopyroxene_thermobarometry.P_Put2008_eq29a(T, *, Si_Liq_cat_frac, Mg_Liq_cat_frac, Fet_Opx_cat_6ox, FmAl2SiO6, Na_Liq_cat_frac, Al_Liq_cat_frac, K_Liq_cat_frac, H2O_Liq, NaAlSi2O6)>,
 <function Thermobar.orthopyroxene_thermobarometry.P_Put2008_eq29b(T, *, ln_FmAl2SiO6_liq, Al_Liq_cat_frac, Mg_Liq_cat_frac, Fet_Liq_cat_frac, Si_Opx_cat_6ox, Fet_Opx_cat_6ox, Na_Liq_cat_frac, K_Liq_cat_frac, H2O_Liq)>,
 <function Thermobar.orthopyroxene_thermobarometry.P_Put2008_eq29c(T, *, Al_Opx_cat_6ox, Ca_Opx_cat_6ox, Cr_Opx_cat_6ox)>,
 <function Thermobar.orthopyroxene_thermobarometry.P_Put2008_eq29cnoCr(T, *, Al_Opx_cat_6ox, Ca_Opx_cat_6ox, Cr_Opx_cat_6ox)>,
 <function Thermobar.orthopyroxene_thermobarometry.P_Put_Felsic_Opx(T=None, *, Al2O3_Opx, Al2O3_Liq)>,
 <function Thermobar.orthopyroxene_thermobarometry.P_Put_Global_Opx(T=None, *, MgO_Liq, Al2O3_Opx, Al2O3_Liq, Na2O_Liq, K2O_Liq)>}
Example 1 - temperature for a known pressure and water content
1a - Equation 28a, fixed pressure
Here, we calculate temperature using the H2O content given in the H2O_Liq column (the default), and P=5 kbar
We choose T_Put2008_eq28a for temperature
[7]:
Temp_T28a=pt.calculate_opx_liq_temp(opx_comps=Opxs, liq_comps=Liqs,
                                    equationT="T_Put2008_eq28a", P=5)-273.15
Temp_T28a
[7]:
0    1117.972951
1    1117.985930
2    1062.099511
3    1077.766688
4    1037.866109
dtype: float64
1b - As above, but overwriting the input spreadsheet water content with an integer.
[8]:
Temp_T28a_0H2O=pt.calculate_opx_liq_temp(opx_comps=Opxs, liq_comps=Liqs,
                        equationT="T_Put2008_eq28a", P=5, H2O_Liq=0)-273.15 # convert to C
Temp_T28a_0H2O
[8]:
0    1178.028325
1    1219.414583
2    1153.227807
3    1171.722220
4    1124.713370
dtype: float64
1c - we can also specify eq_tests=True to get a full dataframe back with all the components, as well as a number of equilibrium test values
[9]:
Temp_T28a_0H2O_EqTests=pt.calculate_opx_liq_temp(opx_comps=Opxs, liq_comps=Liqs,
                        equationT="T_Put2008_eq28a", P=5, H2O_Liq=0, eq_tests=True)
Temp_T28a_0H2O_EqTests
[9]:
| T_K_calc | eq_tests_Kd_Fe_Mg_Fet | eq_tests_Kd_Fe_Mg_Fe2 | SiO2_Liq | Kd Eq (Put2008+-0.06) | TiO2_Liq | Al2O3_Liq | FeOt_Liq | MnO_Liq | MgO_Liq | ... | Di_Opx | Mgno_OPX | ln_Fm2Si2O6_liq | ln_FmAl2SiO6_liq | Kd_Fe_Mg_Fet | Kd_Fe_Mg_Fe2 | Ideal_Kd | Delta_Kd_Fe_Mg_Fe2 | Mgno_Liq_noFe3 | Mgno_Liq_Fe2 | |
|---|---|---|---|---|---|---|---|---|---|---|---|---|---|---|---|---|---|---|---|---|---|
| 0 | 1451.178325 | 0.251582 | 0.251582 | 51.1 | Y | 0.93 | 17.5 | 8.91 | 0.18 | 6.09 | ... | 0.028142 | 0.828850 | 5.211708 | -2.879647 | 0.251582 | 0.251582 | 0.304877 | 0.053295 | 0.549218 | 0.549218 |
| 1 | 1492.564583 | 0.165104 | 0.165104 | 51.5 | N | 1.19 | 19.2 | 8.70 | 0.19 | 4.98 | ... | 0.068126 | 0.860725 | 5.202722 | 3.931199 | 0.165104 | 0.165104 | 0.303256 | 0.138151 | 0.505036 | 0.505036 |
| 2 | 1426.377807 | 0.187634 | 0.187634 | 59.1 | N | 0.54 | 19.1 | 5.22 | 0.19 | 3.25 | ... | 0.074962 | 0.855382 | 5.851735 | 4.175071 | 0.187634 | 0.187634 | 0.277184 | 0.089550 | 0.526025 | 0.526025 |
| 3 | 1444.872220 | 0.211297 | 0.211297 | 52.5 | N | 0.98 | 19.2 | 8.04 | 0.20 | 4.99 | ... | 0.053125 | 0.839637 | 5.426741 | 1.519044 | 0.211297 | 0.211297 | 0.300632 | 0.089335 | 0.525239 | 0.525239 |
| 4 | 1397.863370 | 0.144506 | 0.144506 | 56.2 | N | 0.34 | 20.4 | 5.88 | 0.20 | 2.58 | ... | 0.033103 | 0.844054 | 6.297377 | 2.489832 | 0.144506 | 0.144506 | 0.290284 | 0.145777 | 0.438875 | 0.438875 |
5 rows × 92 columns
Example 2 - Calculating pressure for a known temperature
2a - Pressure using equation 29a at 1300 K
[10]:
Temp_P29a=pt.calculate_opx_liq_press(opx_comps=Opxs, liq_comps=Liqs,
                                    equationP="P_Put2008_eq29a", T=1300)
Temp_P29a
[10]:
0     2.401637
1    12.237354
2     9.658047
3     5.585392
4     5.739632
dtype: float64
2b - Overwrite input water content with zero. Return equilibrium tests.
[11]:
Temp_P29a_0H2O=pt.calculate_opx_liq_press(opx_comps=Opxs, liq_comps=Liqs,
    equationP="P_Put2008_eq29a", T=1300, H2O_Liq=0, eq_tests=True)
Temp_P29a_0H2O
[11]:
| SiO2_Liq | P_kbar_calc | eq_tests_Kd_Fe_Mg_Fet | eq_tests_Kd_Fe_Mg_Fe2 | Kd Eq (Put2008+-0.06) | TiO2_Liq | Al2O3_Liq | FeOt_Liq | MnO_Liq | MgO_Liq | ... | Di_Opx | Mgno_OPX | ln_Fm2Si2O6_liq | ln_FmAl2SiO6_liq | Kd_Fe_Mg_Fet | Kd_Fe_Mg_Fe2 | Ideal_Kd | Delta_Kd_Fe_Mg_Fe2 | Mgno_Liq_noFe3 | Mgno_Liq_Fe2 | |
|---|---|---|---|---|---|---|---|---|---|---|---|---|---|---|---|---|---|---|---|---|---|
| 0 | 51.1 | -0.440763 | 0.251582 | 0.251582 | Y | 0.93 | 17.5 | 8.91 | 0.18 | 6.09 | ... | 0.028142 | 0.828850 | 5.211708 | -2.879647 | 0.251582 | 0.251582 | 0.304877 | 0.053295 | 0.549218 | 0.549218 |
| 1 | 51.5 | 7.599754 | 0.165104 | 0.165104 | N | 1.19 | 19.2 | 8.70 | 0.19 | 4.98 | ... | 0.068126 | 0.860725 | 5.202722 | 3.931199 | 0.165104 | 0.165104 | 0.303256 | 0.138151 | 0.505036 | 0.505036 |
| 2 | 59.1 | 5.020447 | 0.187634 | 0.187634 | N | 0.54 | 19.1 | 5.22 | 0.19 | 3.25 | ... | 0.074962 | 0.855382 | 5.851735 | 4.175071 | 0.187634 | 0.187634 | 0.277184 | 0.089550 | 0.526025 | 0.526025 |
| 3 | 52.5 | 0.947792 | 0.211297 | 0.211297 | N | 0.98 | 19.2 | 8.04 | 0.20 | 4.99 | ... | 0.053125 | 0.839637 | 5.426741 | 1.519044 | 0.211297 | 0.211297 | 0.300632 | 0.089335 | 0.525239 | 0.525239 |
| 4 | 56.2 | 1.102032 | 0.144506 | 0.144506 | N | 0.34 | 20.4 | 5.88 | 0.20 | 2.58 | ... | 0.033103 | 0.844054 | 6.297377 | 2.489832 | 0.144506 | 0.144506 | 0.290284 | 0.145777 | 0.438875 | 0.438875 |
5 rows × 92 columns
2c - Can overwrite input Fe3Fet_Liq ratio (or 0 if didnt enter one) with an integer
The affects delta Kd which only uses Fe2+ in the melt
you can compare the equilibrium tests from Fet and Fe2 in the output columns. For the equilibrium test, we only use Fe2+
[12]:
Temp_P29a_0H2O_30Fe=pt.calculate_opx_liq_press(opx_comps=Opxs, liq_comps=Liqs,
                                               equationP="P_Put2008_eq29a", T=1300, H2O_Liq=0,
                                               eq_tests=True, Fe3Fet_Liq=0.3)
Temp_P29a_0H2O_30Fe
[12]:
| SiO2_Liq | P_kbar_calc | eq_tests_Kd_Fe_Mg_Fet | eq_tests_Kd_Fe_Mg_Fe2 | Kd Eq (Put2008+-0.06) | TiO2_Liq | Al2O3_Liq | FeOt_Liq | MnO_Liq | MgO_Liq | ... | Di_Opx | Mgno_OPX | ln_Fm2Si2O6_liq | ln_FmAl2SiO6_liq | Kd_Fe_Mg_Fet | Kd_Fe_Mg_Fe2 | Ideal_Kd | Delta_Kd_Fe_Mg_Fe2 | Mgno_Liq_noFe3 | Mgno_Liq_Fe2 | |
|---|---|---|---|---|---|---|---|---|---|---|---|---|---|---|---|---|---|---|---|---|---|
| 0 | 51.1 | -0.440763 | 0.251582 | 0.359403 | Y | 0.93 | 17.5 | 8.91 | 0.18 | 6.09 | ... | 0.028142 | 0.828850 | 5.211708 | -2.879647 | 0.251582 | 0.359403 | 0.304877 | 0.054526 | 0.549218 | 0.635106 |
| 1 | 51.5 | 7.599754 | 0.165104 | 0.235863 | N | 1.19 | 19.2 | 8.70 | 0.19 | 4.98 | ... | 0.068126 | 0.860725 | 5.202722 | 3.931199 | 0.165104 | 0.235863 | 0.303256 | 0.067392 | 0.505036 | 0.593105 |
| 2 | 59.1 | 5.020447 | 0.187634 | 0.268049 | Y | 0.54 | 19.1 | 5.22 | 0.19 | 3.25 | ... | 0.074962 | 0.855382 | 5.851735 | 4.175071 | 0.187634 | 0.268049 | 0.277184 | 0.009135 | 0.526025 | 0.613220 |
| 3 | 52.5 | 0.947792 | 0.211297 | 0.301853 | Y | 0.98 | 19.2 | 8.04 | 0.20 | 4.99 | ... | 0.053125 | 0.839637 | 5.426741 | 1.519044 | 0.211297 | 0.301853 | 0.300632 | 0.001221 | 0.525239 | 0.612473 |
| 4 | 56.2 | 1.102032 | 0.144506 | 0.206437 | N | 0.34 | 20.4 | 5.88 | 0.20 | 2.58 | ... | 0.033103 | 0.844054 | 6.297377 | 2.489832 | 0.144506 | 0.206437 | 0.290284 | 0.083846 | 0.438875 | 0.527708 |
5 rows × 92 columns
Example 3 - Iterating pressure and temperature
In reality, unles you are an experimentalist, you rarely know pressure and temperature
In Keith Putirka’s spreadsheets, you can link up columns to iterate P and T towards a solution, this can be done here using the function calculate_opx_liq_press_temp
3a - Iterating equation 29b from Putirka (2008) for P, and Beattie (1993) for temperature
Without specifying anything else, you get a dataframe with columns for calculated pressure and temperature
[13]:
PT_iter_29b_Beatt=pt.calculate_opx_liq_press_temp(opx_comps=Opxs, liq_comps=Liqs,
                                                  equationP="P_Put2008_eq29b",
                                                  equationT="T_Beatt1993_opx")
PT_iter_29b_Beatt
[13]:
| P_kbar_calc | T_K_calc | Delta_P_kbar_Iter | Delta_T_K_Iter | |
|---|---|---|---|---|
| 0 | -2.083363 | 1396.863533 | 0.000000e+00 | 0.000000e+00 |
| 1 | 15.124832 | 1499.003345 | 2.131628e-14 | 2.273737e-13 |
| 2 | 15.723512 | 1496.583095 | 2.131628e-14 | 2.273737e-13 |
| 3 | 6.616612 | 1445.263817 | 0.000000e+00 | 0.000000e+00 |
| 4 | 6.404897 | 1400.627400 | 0.000000e+00 | 0.000000e+00 |
3b - As above, but specifying eq_tests=True
This returns equilibrium tests, you can check if they passed looking at the “Kd Eq (Put2008+-0.06)” column
[14]:
PT_iter_29b_Beatt_EqTests=pt.calculate_opx_liq_press_temp(opx_comps=Opxs, liq_comps=Liqs,
                       equationP="P_Put2008_eq29b", equationT="T_Beatt1993_opx", eq_tests=True)
PT_iter_29b_Beatt_EqTests
[14]:
| P_kbar_calc | T_K_calc | Delta_P_kbar_Iter | Delta_T_K_Iter | eq_tests_Kd_Fe_Mg_Fet | eq_tests_Kd_Fe_Mg_Fe2 | SiO2_Liq | Kd Eq (Put2008+-0.06) | TiO2_Liq | Al2O3_Liq | ... | Di_Opx | Mgno_OPX | ln_Fm2Si2O6_liq | ln_FmAl2SiO6_liq | Kd_Fe_Mg_Fet | Kd_Fe_Mg_Fe2 | Ideal_Kd | Delta_Kd_Fe_Mg_Fe2 | Mgno_Liq_noFe3 | Mgno_Liq_Fe2 | |
|---|---|---|---|---|---|---|---|---|---|---|---|---|---|---|---|---|---|---|---|---|---|
| 0 | -2.083363 | 1396.863533 | 0.000000e+00 | 0.000000e+00 | 0.251582 | 0.251582 | 51.1 | Y | 0.93 | 17.5 | ... | 0.028142 | 0.828850 | 5.211708 | -2.879647 | 0.251582 | 0.251582 | 0.304877 | 0.053295 | 0.549218 | 0.549218 |
| 1 | 15.124832 | 1499.003345 | 2.131628e-14 | 2.273737e-13 | 0.165104 | 0.165104 | 51.5 | N | 1.19 | 19.2 | ... | 0.068126 | 0.860725 | 5.202722 | 3.931199 | 0.165104 | 0.165104 | 0.303256 | 0.138151 | 0.505036 | 0.505036 |
| 2 | 15.723512 | 1496.583095 | 2.131628e-14 | 2.273737e-13 | 0.187634 | 0.187634 | 59.1 | N | 0.54 | 19.1 | ... | 0.074962 | 0.855382 | 5.851735 | 4.175071 | 0.187634 | 0.187634 | 0.277184 | 0.089550 | 0.526025 | 0.526025 |
| 3 | 6.616612 | 1445.263817 | 0.000000e+00 | 0.000000e+00 | 0.211297 | 0.211297 | 52.5 | N | 0.98 | 19.2 | ... | 0.053125 | 0.839637 | 5.426741 | 1.519044 | 0.211297 | 0.211297 | 0.300632 | 0.089335 | 0.525239 | 0.525239 |
| 4 | 6.404897 | 1400.627400 | 0.000000e+00 | 0.000000e+00 | 0.144506 | 0.144506 | 56.2 | N | 0.34 | 20.4 | ... | 0.033103 | 0.844054 | 6.297377 | 2.489832 | 0.144506 | 0.144506 | 0.290284 | 0.145777 | 0.438875 | 0.438875 |
5 rows × 95 columns
Example 4: Orthopyroxene only barometry
very similar to opx-liq functions, just dont need to specify liquid compositions
Most common problem is that equation 29c uses the ln of the Cr2O3 component, which if you dont enter any Cr, means the function returns a NaN (as you can’t ln a zero).
[15]:
Press=pt.calculate_opx_only_press(opx_comps=Opxs, equationP="P_Put2008_eq29c", T=1300)
Press
c:\users\penny\box\postdoc\mybarometers\thermobar_outer\src\Thermobar\orthopyroxene_thermobarometry.py:234: UserWarning: The selected barometer uses the log of Cr2O3 component of Opx, which is zero for some of your compositions. This means the function will return infinity.
  w.warn('The selected barometer uses the log of Cr2O3 component of '
[15]:
0    0.631893
1         NaN
2    5.410426
3    0.482388
4    0.397185
dtype: float64
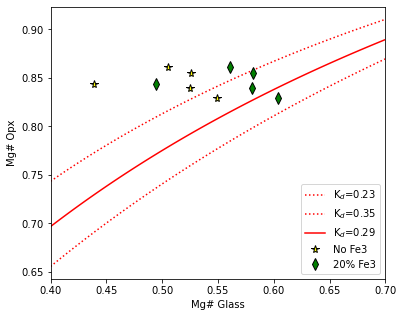
Example 5: Plotting orthopyroxene compositions on a rhodes diagram
Option 1, specify simple=True, just uses 0.29 +-0.07 from Putirka (2008)
Option 2, specify a liquid composition (say lots of opxs from a single lava flow), calculates mean Si cation fraction for all liquids, uses this to calculate KD
Option 3, specify a min and max Kd
Step 1 - calculate Mg# for opx and liquid (can either treat FeT as Fe2, or partition into Fe2 and Fe3, only calculated Kd using Fe2)
[16]:
opx_comps_Fe3=pt.calculate_orthopyroxene_liquid_components(liq_comps=Liqs,
                                            opx_comps=Opxs, Fe3Fet_Liq=0.2)
Step 2 - calculate rhodes diagram lines between Mg#=0.4 and Mg#=0.7
This gives the simple values of Kd=0.29+0.06
[17]:
eq_lines_1=pt.calculate_opx_rhodes_diagram_lines(Min_Mgno=0.4, Max_Mgno=0.7)
eq_lines_1.head()
[17]:
| Mg#_Liq | Eq_Opx_Mg# (Kd=0.23) | Eq_Opx_Mg# (Kd=0.29) | Eq_Opx_Mg# (Kd=0.35) | |
|---|---|---|---|---|
| 0 | 0.400000 | 0.743494 | 0.696864 | 0.655738 |
| 1 | 0.403030 | 0.745892 | 0.699521 | 0.658579 |
| 2 | 0.406061 | 0.748269 | 0.702159 | 0.661402 |
| 3 | 0.409091 | 0.750626 | 0.704777 | 0.664207 |
| 4 | 0.412121 | 0.752962 | 0.707375 | 0.666994 |
Step 3 - Plot these lines, along with measured opxs. Here we draw symbols where we account for Fe3+ (diamond), and just using Fet in the glas (stars)
[18]:
fig, (ax1) = plt.subplots(1, 1, figsize = (6,5))
ax1.plot(eq_lines_1['Mg#_Liq'], eq_lines_1['Eq_Opx_Mg# (Kd=0.23)'], ':r', label="K$_d$=0.23")
ax1.plot(eq_lines_1['Mg#_Liq'], eq_lines_1['Eq_Opx_Mg# (Kd=0.35)'], ':r', label="K$_d$=0.35")
ax1.plot(eq_lines_1['Mg#_Liq'], eq_lines_1['Eq_Opx_Mg# (Kd=0.29)'], '-r', label="K$_d$=0.29")
ax1.set_xlim([0.4, 0.7])
ax1.plot(opx_comps_Fe3['Mgno_Liq_noFe3'], opx_comps_Fe3['Mgno_OPX'], '*k', mfc='yellow', ms=8, label="No Fe3")
ax1.plot(opx_comps_Fe3['Mgno_Liq_Fe2'], opx_comps_Fe3['Mgno_OPX'], 'dk', mfc='green', ms=8, label="20% Fe3")
ax1.legend()
ax1.set_xlabel('Mg# Glass')
ax1.set_ylabel('Mg# Opx')
[18]:
Text(0, 0.5, 'Mg# Opx')
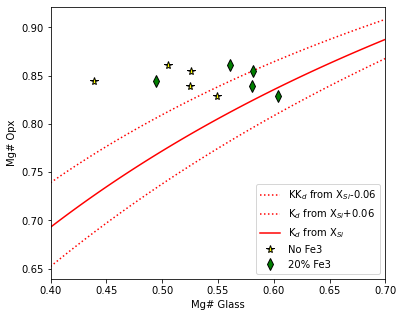
Example 5 - Rhodes diagram using a Kd model based on the Si content of the liquid
In this case, we enter a liquid composition into the rhodes diagram function
As this works by averaging the Si content of all inputted liquid to calculate Kd, this only recomended if liquids very similar in composition)
[19]:
eq_lines_2=pt.calculate_opx_rhodes_diagram_lines(Min_Mgno=0.4, Max_Mgno=0.7, liq_comps=Liqs)
eq_lines_2.head()
[19]:
| Mg#_Liq | Eq_Opx_Mg# (Kd=0.23) | Eq_Opx_Mg# (Kd=0.29) | Eq_Opx_Mg# (Kd=0.35) | Kd_XSi_P2008 | Eq_Opx_Mg# (Kd_XSi_P2008) | Eq_Opx_Mg# (Kd_XSi_P2008)+0.06 | Eq_Opx_Mg# (Kd_XSi_P2008)-0.06 | |
|---|---|---|---|---|---|---|---|---|
| 0 | 0.400000 | 0.743494 | 0.696864 | 0.655738 | 0.295247 | 0.693063 | 0.652371 | 0.739169 |
| 1 | 0.403030 | 0.745892 | 0.699521 | 0.658579 | 0.295247 | 0.695739 | 0.655225 | 0.741593 |
| 2 | 0.406061 | 0.748269 | 0.702159 | 0.661402 | 0.295247 | 0.698396 | 0.658062 | 0.743997 |
| 3 | 0.409091 | 0.750626 | 0.704777 | 0.664207 | 0.295247 | 0.701033 | 0.660880 | 0.746380 |
| 4 | 0.412121 | 0.752962 | 0.707375 | 0.666994 | 0.295247 | 0.703650 | 0.663681 | 0.748743 |
[20]:
fig, (ax1) = plt.subplots(1, 1, figsize = (6,5))
ax1.plot(eq_lines_2['Mg#_Liq'], eq_lines_2['Eq_Opx_Mg# (Kd_XSi_P2008)-0.06'], ':r', label="KK$_d$ from X$_{Si}$-0.06")
ax1.plot(eq_lines_2['Mg#_Liq'], eq_lines_2['Eq_Opx_Mg# (Kd_XSi_P2008)+0.06'], ':r', label="K$_d$ from X$_{Si}$+0.06")
ax1.plot(eq_lines_2['Mg#_Liq'], eq_lines_2['Eq_Opx_Mg# (Kd_XSi_P2008)'], '-r', label="K$_d$ from X$_{Si}$")
ax1.set_xlim([0.4, 0.7])
ax1.plot(opx_comps_Fe3['Mgno_Liq_noFe3'], opx_comps_Fe3['Mgno_OPX'], '*k', mfc='yellow', ms=8, label="No Fe3")
ax1.plot(opx_comps_Fe3['Mgno_Liq_Fe2'], opx_comps_Fe3['Mgno_OPX'], 'dk', mfc='green', ms=8, label="20% Fe3")
ax1.legend()
ax1.set_xlabel('Mg# Glass')
ax1.set_ylabel('Mg# Opx')
[20]:
Text(0, 0.5, 'Mg# Opx')